Irish vs Kiowa In Labor Force | Age 25-29
COMPARE
Irish
Kiowa
In Labor Force | Age 25-29
In Labor Force | Age 25-29 Comparison
Irish
Kiowa
85.0%
IN LABOR FORCE | AGE 25-29
90.6/ 100
METRIC RATING
113th/ 347
METRIC RANK
81.6%
IN LABOR FORCE | AGE 25-29
0.0/ 100
METRIC RATING
322nd/ 347
METRIC RANK
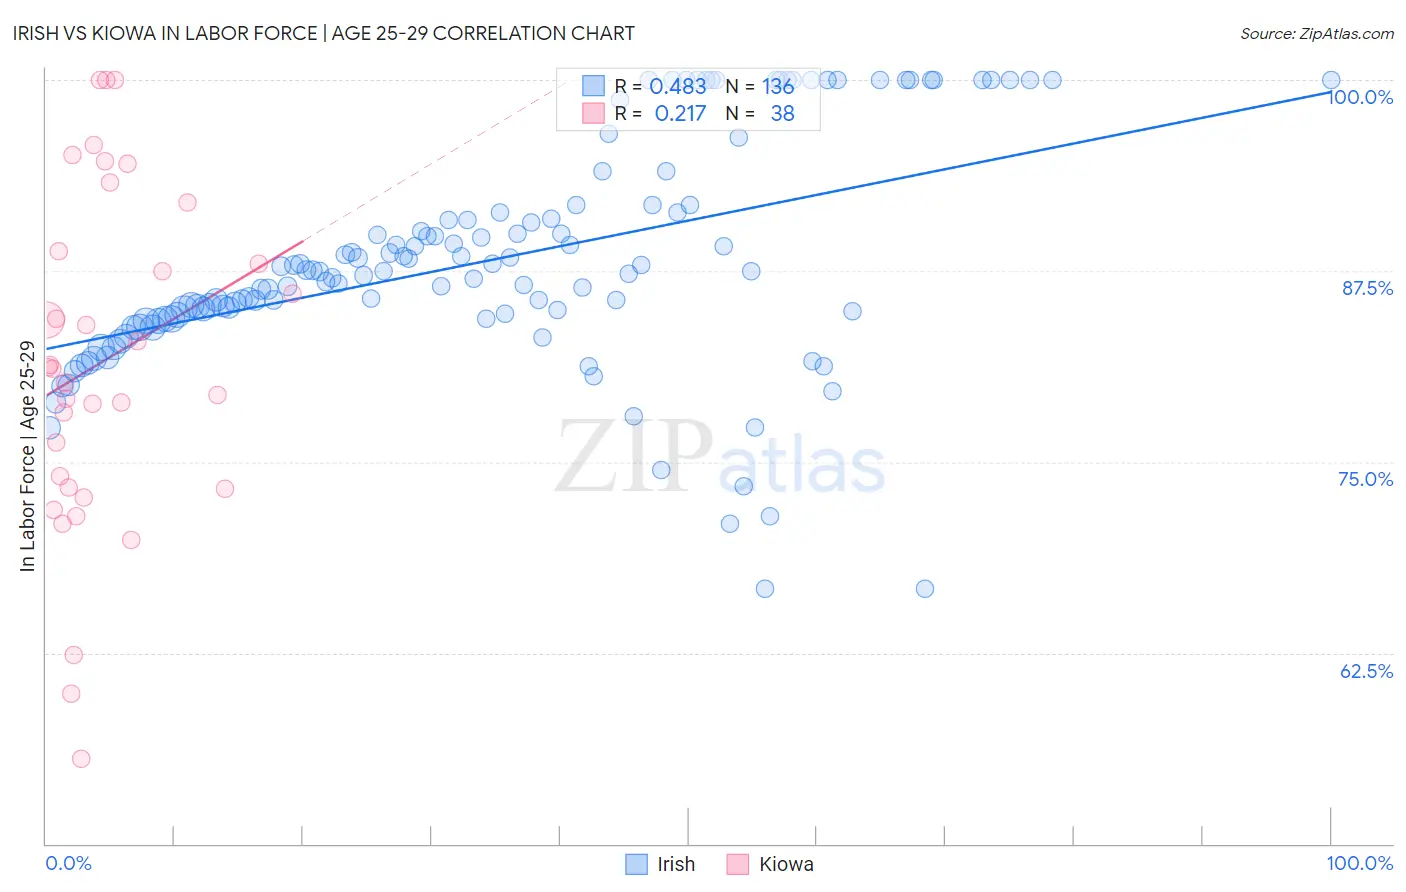
Irish vs Kiowa In Labor Force | Age 25-29 Correlation Chart
The statistical analysis conducted on geographies consisting of 578,488,180 people shows a moderate positive correlation between the proportion of Irish and labor force participation rate among population between the ages 25 and 29 in the United States with a correlation coefficient (R) of 0.483 and weighted average of 85.0%. Similarly, the statistical analysis conducted on geographies consisting of 56,097,526 people shows a weak positive correlation between the proportion of Kiowa and labor force participation rate among population between the ages 25 and 29 in the United States with a correlation coefficient (R) of 0.217 and weighted average of 81.6%, a difference of 4.2%.
In Labor Force | Age 25-29 Correlation Summary
| Measurement | Irish | Kiowa |
| Minimum | 66.7% | 55.6% |
| Maximum | 100.0% | 100.0% |
| Range | 33.3% | 44.4% |
| Mean | 88.2% | 81.6% |
| Median | 87.5% | 81.1% |
| Interquartile 25% (IQ1) | 84.3% | 73.3% |
| Interquartile 75% (IQ3) | 91.3% | 88.8% |
| Interquartile Range (IQR) | 7.0% | 15.5% |
| Standard Deviation (Sample) | 7.4% | 11.0% |
| Standard Deviation (Population) | 7.4% | 10.8% |
Similar Demographics by In Labor Force | Age 25-29
Demographics Similar to Irish by In Labor Force | Age 25-29
In terms of in labor force | age 25-29, the demographic groups most similar to Irish are Senegalese (85.0%, a difference of 0.010%), Immigrants from Malaysia (85.0%, a difference of 0.010%), New Zealander (85.0%, a difference of 0.020%), Immigrants from Middle Africa (85.0%, a difference of 0.020%), and Immigrants from Austria (85.0%, a difference of 0.030%).
| Demographics | Rating | Rank | In Labor Force | Age 25-29 |
| Czechoslovakians | 92.6 /100 | #106 | Exceptional 85.0% |
| Immigrants | Southern Europe | 92.3 /100 | #107 | Exceptional 85.0% |
| Immigrants | Austria | 91.9 /100 | #108 | Exceptional 85.0% |
| Costa Ricans | 91.9 /100 | #109 | Exceptional 85.0% |
| New Zealanders | 91.5 /100 | #110 | Exceptional 85.0% |
| Immigrants | Middle Africa | 91.4 /100 | #111 | Exceptional 85.0% |
| Senegalese | 90.9 /100 | #112 | Exceptional 85.0% |
| Irish | 90.6 /100 | #113 | Exceptional 85.0% |
| Immigrants | Malaysia | 90.4 /100 | #114 | Exceptional 85.0% |
| South Africans | 88.9 /100 | #115 | Excellent 85.0% |
| Chileans | 88.8 /100 | #116 | Excellent 85.0% |
| Immigrants | Belarus | 88.0 /100 | #117 | Excellent 85.0% |
| Finns | 87.8 /100 | #118 | Excellent 85.0% |
| Filipinos | 87.1 /100 | #119 | Excellent 84.9% |
| Immigrants | South Africa | 86.1 /100 | #120 | Excellent 84.9% |
Demographics Similar to Kiowa by In Labor Force | Age 25-29
In terms of in labor force | age 25-29, the demographic groups most similar to Kiowa are Shoshone (81.6%, a difference of 0.010%), Alaska Native (81.6%, a difference of 0.050%), Colville (81.6%, a difference of 0.070%), Seminole (81.7%, a difference of 0.12%), and Comanche (81.9%, a difference of 0.33%).
| Demographics | Rating | Rank | In Labor Force | Age 25-29 |
| Immigrants | Mexico | 0.0 /100 | #315 | Tragic 82.0% |
| Mexicans | 0.0 /100 | #316 | Tragic 81.9% |
| Chickasaw | 0.0 /100 | #317 | Tragic 81.9% |
| Comanche | 0.0 /100 | #318 | Tragic 81.9% |
| Seminole | 0.0 /100 | #319 | Tragic 81.7% |
| Colville | 0.0 /100 | #320 | Tragic 81.6% |
| Shoshone | 0.0 /100 | #321 | Tragic 81.6% |
| Kiowa | 0.0 /100 | #322 | Tragic 81.6% |
| Alaska Natives | 0.0 /100 | #323 | Tragic 81.6% |
| Houma | 0.0 /100 | #324 | Tragic 81.2% |
| Dutch West Indians | 0.0 /100 | #325 | Tragic 81.1% |
| Choctaw | 0.0 /100 | #326 | Tragic 81.0% |
| Ute | 0.0 /100 | #327 | Tragic 80.8% |
| Creek | 0.0 /100 | #328 | Tragic 80.7% |
| Yakama | 0.0 /100 | #329 | Tragic 80.6% |