Irish vs Portuguese In Labor Force | Age 25-29
COMPARE
Irish
Portuguese
In Labor Force | Age 25-29
In Labor Force | Age 25-29 Comparison
Irish
Portuguese
85.0%
IN LABOR FORCE | AGE 25-29
90.6/ 100
METRIC RATING
113th/ 347
METRIC RANK
84.4%
IN LABOR FORCE | AGE 25-29
21.2/ 100
METRIC RATING
194th/ 347
METRIC RANK
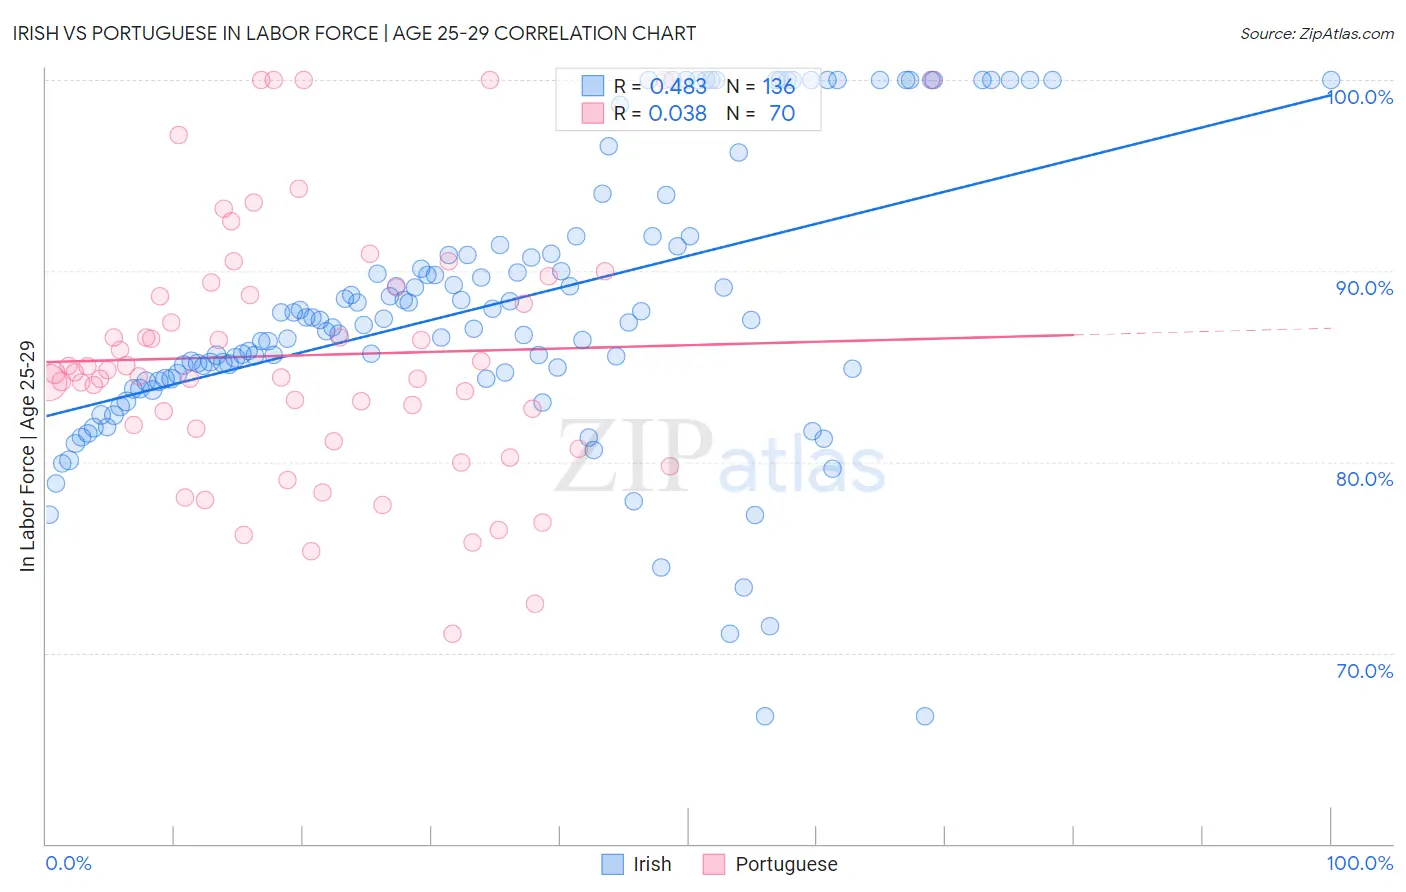
Irish vs Portuguese In Labor Force | Age 25-29 Correlation Chart
The statistical analysis conducted on geographies consisting of 578,488,180 people shows a moderate positive correlation between the proportion of Irish and labor force participation rate among population between the ages 25 and 29 in the United States with a correlation coefficient (R) of 0.483 and weighted average of 85.0%. Similarly, the statistical analysis conducted on geographies consisting of 450,025,288 people shows no correlation between the proportion of Portuguese and labor force participation rate among population between the ages 25 and 29 in the United States with a correlation coefficient (R) of 0.038 and weighted average of 84.4%, a difference of 0.66%.
In Labor Force | Age 25-29 Correlation Summary
| Measurement | Irish | Portuguese |
| Minimum | 66.7% | 71.0% |
| Maximum | 100.0% | 100.0% |
| Range | 33.3% | 29.0% |
| Mean | 88.2% | 85.6% |
| Median | 87.5% | 84.7% |
| Interquartile 25% (IQ1) | 84.3% | 81.7% |
| Interquartile 75% (IQ3) | 91.3% | 89.1% |
| Interquartile Range (IQR) | 7.0% | 7.4% |
| Standard Deviation (Sample) | 7.4% | 6.7% |
| Standard Deviation (Population) | 7.4% | 6.7% |
Similar Demographics by In Labor Force | Age 25-29
Demographics Similar to Irish by In Labor Force | Age 25-29
In terms of in labor force | age 25-29, the demographic groups most similar to Irish are Senegalese (85.0%, a difference of 0.010%), Immigrants from Malaysia (85.0%, a difference of 0.010%), New Zealander (85.0%, a difference of 0.020%), Immigrants from Middle Africa (85.0%, a difference of 0.020%), and Immigrants from Austria (85.0%, a difference of 0.030%).
| Demographics | Rating | Rank | In Labor Force | Age 25-29 |
| Czechoslovakians | 92.6 /100 | #106 | Exceptional 85.0% |
| Immigrants | Southern Europe | 92.3 /100 | #107 | Exceptional 85.0% |
| Immigrants | Austria | 91.9 /100 | #108 | Exceptional 85.0% |
| Costa Ricans | 91.9 /100 | #109 | Exceptional 85.0% |
| New Zealanders | 91.5 /100 | #110 | Exceptional 85.0% |
| Immigrants | Middle Africa | 91.4 /100 | #111 | Exceptional 85.0% |
| Senegalese | 90.9 /100 | #112 | Exceptional 85.0% |
| Irish | 90.6 /100 | #113 | Exceptional 85.0% |
| Immigrants | Malaysia | 90.4 /100 | #114 | Exceptional 85.0% |
| South Africans | 88.9 /100 | #115 | Excellent 85.0% |
| Chileans | 88.8 /100 | #116 | Excellent 85.0% |
| Immigrants | Belarus | 88.0 /100 | #117 | Excellent 85.0% |
| Finns | 87.8 /100 | #118 | Excellent 85.0% |
| Filipinos | 87.1 /100 | #119 | Excellent 84.9% |
| Immigrants | South Africa | 86.1 /100 | #120 | Excellent 84.9% |
Demographics Similar to Portuguese by In Labor Force | Age 25-29
In terms of in labor force | age 25-29, the demographic groups most similar to Portuguese are Immigrants from Israel (84.4%, a difference of 0.010%), Immigrants from South Eastern Asia (84.4%, a difference of 0.020%), Tlingit-Haida (84.4%, a difference of 0.020%), Immigrants from Iraq (84.4%, a difference of 0.030%), and Immigrants from Germany (84.4%, a difference of 0.030%).
| Demographics | Rating | Rank | In Labor Force | Age 25-29 |
| Immigrants | Portugal | 34.7 /100 | #187 | Fair 84.6% |
| Immigrants | Ukraine | 33.7 /100 | #188 | Fair 84.5% |
| Moroccans | 32.6 /100 | #189 | Fair 84.5% |
| Welsh | 31.1 /100 | #190 | Fair 84.5% |
| Zimbabweans | 28.7 /100 | #191 | Fair 84.5% |
| English | 25.8 /100 | #192 | Fair 84.5% |
| South American Indians | 25.0 /100 | #193 | Fair 84.5% |
| Portuguese | 21.2 /100 | #194 | Fair 84.4% |
| Immigrants | Israel | 20.8 /100 | #195 | Fair 84.4% |
| Immigrants | South Eastern Asia | 19.5 /100 | #196 | Poor 84.4% |
| Tlingit-Haida | 19.3 /100 | #197 | Poor 84.4% |
| Immigrants | Iraq | 19.0 /100 | #198 | Poor 84.4% |
| Immigrants | Germany | 18.3 /100 | #199 | Poor 84.4% |
| Immigrants | Kazakhstan | 17.5 /100 | #200 | Poor 84.4% |
| Laotians | 16.6 /100 | #201 | Poor 84.4% |