Immigrants from Mexico vs Japanese In Labor Force | Age 45-54
COMPARE
Immigrants from Mexico
Japanese
In Labor Force | Age 45-54
In Labor Force | Age 45-54 Comparison
Immigrants from Mexico
Japanese
79.7%
IN LABOR FORCE | AGE 45-54
0.0/ 100
METRIC RATING
312th/ 347
METRIC RANK
81.6%
IN LABOR FORCE | AGE 45-54
0.2/ 100
METRIC RATING
253rd/ 347
METRIC RANK
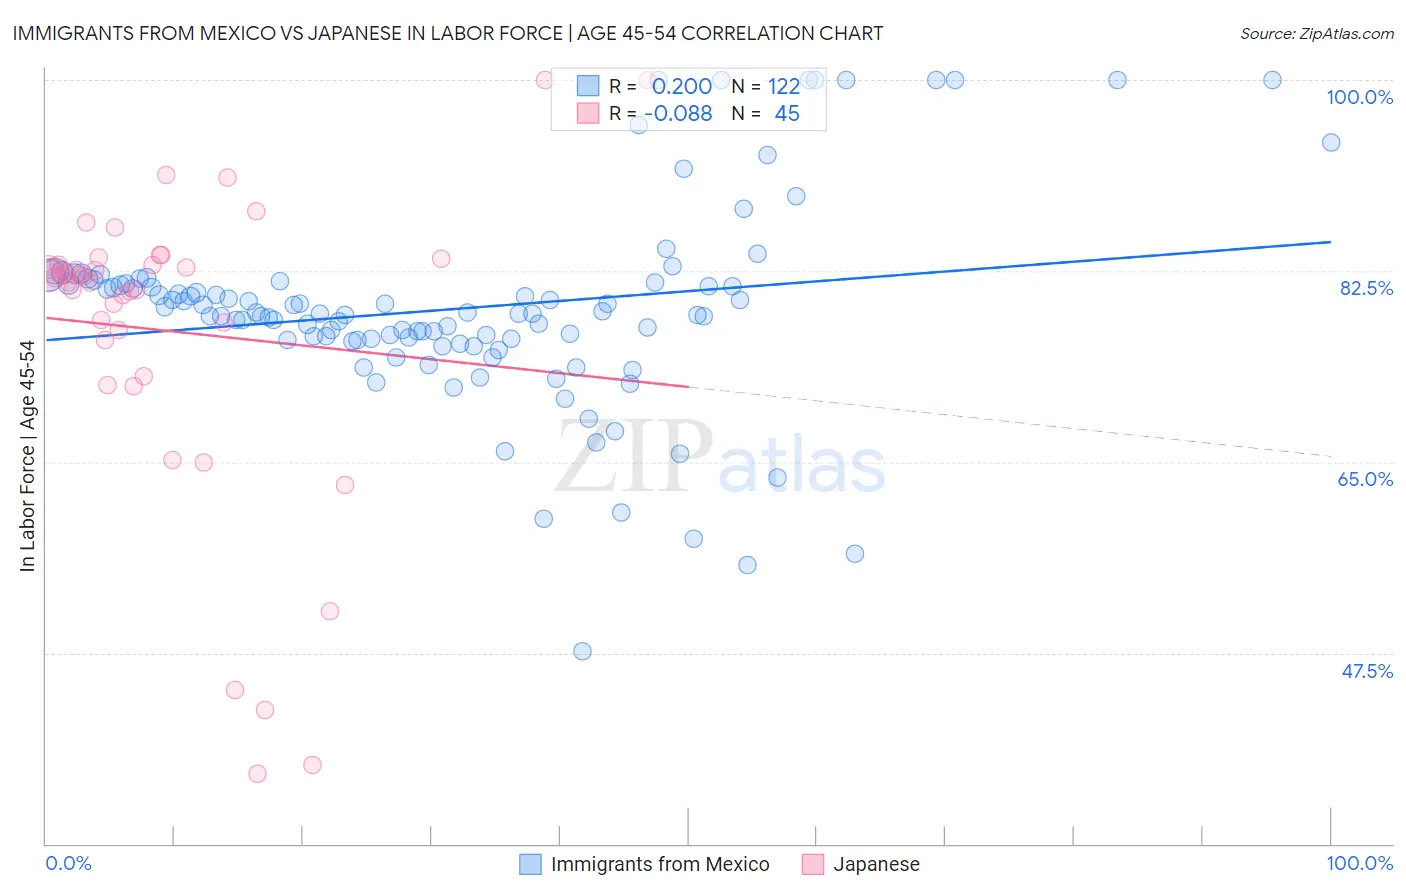
Immigrants from Mexico vs Japanese In Labor Force | Age 45-54 Correlation Chart
The statistical analysis conducted on geographies consisting of 513,319,268 people shows a poor positive correlation between the proportion of Immigrants from Mexico and labor force participation rate among population between the ages 45 and 54 in the United States with a correlation coefficient (R) of 0.200 and weighted average of 79.7%. Similarly, the statistical analysis conducted on geographies consisting of 249,074,736 people shows a slight negative correlation between the proportion of Japanese and labor force participation rate among population between the ages 45 and 54 in the United States with a correlation coefficient (R) of -0.088 and weighted average of 81.6%, a difference of 2.4%.
In Labor Force | Age 45-54 Correlation Summary
| Measurement | Immigrants from Mexico | Japanese |
| Minimum | 47.6% | 36.4% |
| Maximum | 100.0% | 100.0% |
| Range | 52.4% | 63.6% |
| Mean | 79.0% | 77.0% |
| Median | 78.6% | 81.9% |
| Interquartile 25% (IQ1) | 76.2% | 74.5% |
| Interquartile 75% (IQ3) | 81.4% | 83.3% |
| Interquartile Range (IQR) | 5.2% | 8.8% |
| Standard Deviation (Sample) | 9.1% | 14.4% |
| Standard Deviation (Population) | 9.1% | 14.3% |
Similar Demographics by In Labor Force | Age 45-54
Demographics Similar to Immigrants from Mexico by In Labor Force | Age 45-54
In terms of in labor force | age 45-54, the demographic groups most similar to Immigrants from Mexico are Mexican (79.8%, a difference of 0.14%), Colville (79.5%, a difference of 0.24%), Inupiat (79.9%, a difference of 0.25%), Ottawa (79.5%, a difference of 0.28%), and Potawatomi (80.0%, a difference of 0.34%).
| Demographics | Rating | Rank | In Labor Force | Age 45-54 |
| Immigrants | Dominican Republic | 0.0 /100 | #305 | Tragic 80.1% |
| Spanish Americans | 0.0 /100 | #306 | Tragic 80.1% |
| Blackfeet | 0.0 /100 | #307 | Tragic 80.0% |
| Central American Indians | 0.0 /100 | #308 | Tragic 80.0% |
| Potawatomi | 0.0 /100 | #309 | Tragic 80.0% |
| Inupiat | 0.0 /100 | #310 | Tragic 79.9% |
| Mexicans | 0.0 /100 | #311 | Tragic 79.8% |
| Immigrants | Mexico | 0.0 /100 | #312 | Tragic 79.7% |
| Colville | 0.0 /100 | #313 | Tragic 79.5% |
| Ottawa | 0.0 /100 | #314 | Tragic 79.5% |
| Blacks/African Americans | 0.0 /100 | #315 | Tragic 79.3% |
| Shoshone | 0.0 /100 | #316 | Tragic 79.3% |
| Comanche | 0.0 /100 | #317 | Tragic 79.2% |
| Chickasaw | 0.0 /100 | #318 | Tragic 79.0% |
| Cherokee | 0.0 /100 | #319 | Tragic 79.0% |
Demographics Similar to Japanese by In Labor Force | Age 45-54
In terms of in labor force | age 45-54, the demographic groups most similar to Japanese are Immigrants from Laos (81.6%, a difference of 0.010%), Scotch-Irish (81.6%, a difference of 0.020%), Pennsylvania German (81.6%, a difference of 0.030%), Guamanian/Chamorro (81.6%, a difference of 0.040%), and Barbadian (81.6%, a difference of 0.050%).
| Demographics | Rating | Rank | In Labor Force | Age 45-54 |
| Alaskan Athabascans | 0.4 /100 | #246 | Tragic 81.8% |
| Central Americans | 0.4 /100 | #247 | Tragic 81.7% |
| Puget Sound Salish | 0.3 /100 | #248 | Tragic 81.7% |
| Hmong | 0.3 /100 | #249 | Tragic 81.7% |
| Immigrants | Armenia | 0.2 /100 | #250 | Tragic 81.7% |
| Guamanians/Chamorros | 0.2 /100 | #251 | Tragic 81.6% |
| Pennsylvania Germans | 0.2 /100 | #252 | Tragic 81.6% |
| Japanese | 0.2 /100 | #253 | Tragic 81.6% |
| Immigrants | Laos | 0.2 /100 | #254 | Tragic 81.6% |
| Scotch-Irish | 0.2 /100 | #255 | Tragic 81.6% |
| Barbadians | 0.1 /100 | #256 | Tragic 81.6% |
| Immigrants | Congo | 0.1 /100 | #257 | Tragic 81.6% |
| Immigrants | Fiji | 0.1 /100 | #258 | Tragic 81.5% |
| Guyanese | 0.1 /100 | #259 | Tragic 81.5% |
| Spaniards | 0.1 /100 | #260 | Tragic 81.5% |