Immigrants from Denmark vs Immigrants from Syria In Labor Force | Age 20-24
COMPARE
Immigrants from Denmark
Immigrants from Syria
In Labor Force | Age 20-24
In Labor Force | Age 20-24 Comparison
Immigrants from Denmark
Immigrants from Syria
74.8%
IN LABOR FORCE | AGE 20-24
25.8/ 100
METRIC RATING
194th/ 347
METRIC RANK
74.0%
IN LABOR FORCE | AGE 20-24
1.9/ 100
METRIC RATING
243rd/ 347
METRIC RANK
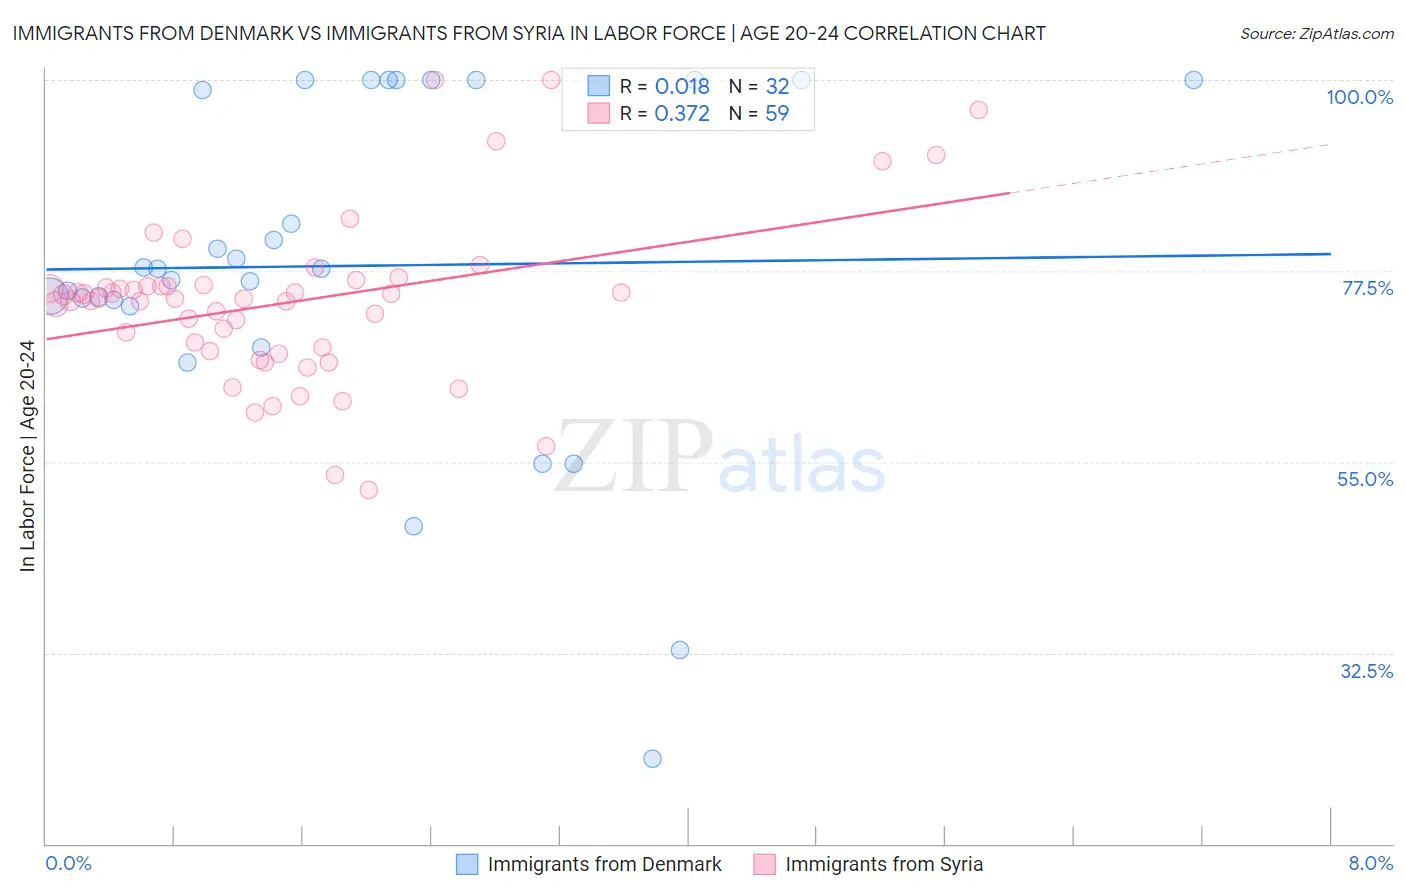
Immigrants from Denmark vs Immigrants from Syria In Labor Force | Age 20-24 Correlation Chart
The statistical analysis conducted on geographies consisting of 136,401,284 people shows no correlation between the proportion of Immigrants from Denmark and labor force participation rate among population between the ages 20 and 24 in the United States with a correlation coefficient (R) of 0.018 and weighted average of 74.8%. Similarly, the statistical analysis conducted on geographies consisting of 174,096,608 people shows a mild positive correlation between the proportion of Immigrants from Syria and labor force participation rate among population between the ages 20 and 24 in the United States with a correlation coefficient (R) of 0.372 and weighted average of 74.0%, a difference of 1.1%.
In Labor Force | Age 20-24 Correlation Summary
| Measurement | Immigrants from Denmark | Immigrants from Syria |
| Minimum | 20.0% | 51.7% |
| Maximum | 100.0% | 100.0% |
| Range | 80.0% | 48.3% |
| Mean | 78.1% | 73.8% |
| Median | 77.7% | 74.2% |
| Interquartile 25% (IQ1) | 73.7% | 68.0% |
| Interquartile 75% (IQ3) | 100.0% | 75.7% |
| Interquartile Range (IQR) | 26.3% | 7.7% |
| Standard Deviation (Sample) | 20.1% | 9.7% |
| Standard Deviation (Population) | 19.8% | 9.6% |
Similar Demographics by In Labor Force | Age 20-24
Demographics Similar to Immigrants from Denmark by In Labor Force | Age 20-24
In terms of in labor force | age 20-24, the demographic groups most similar to Immigrants from Denmark are Eastern European (74.8%, a difference of 0.010%), Immigrants from Vietnam (74.7%, a difference of 0.010%), Panamanian (74.7%, a difference of 0.010%), Immigrants from Europe (74.8%, a difference of 0.030%), and Alsatian (74.8%, a difference of 0.030%).
| Demographics | Rating | Rank | In Labor Force | Age 20-24 |
| Immigrants | Honduras | 33.5 /100 | #187 | Fair 74.9% |
| Hondurans | 32.7 /100 | #188 | Fair 74.8% |
| Immigrants | Northern Europe | 32.6 /100 | #189 | Fair 74.8% |
| Russians | 32.2 /100 | #190 | Fair 74.8% |
| Senegalese | 28.1 /100 | #191 | Fair 74.8% |
| Immigrants | Europe | 27.5 /100 | #192 | Fair 74.8% |
| Alsatians | 27.1 /100 | #193 | Fair 74.8% |
| Immigrants | Denmark | 25.8 /100 | #194 | Fair 74.8% |
| Eastern Europeans | 25.4 /100 | #195 | Fair 74.8% |
| Immigrants | Vietnam | 25.1 /100 | #196 | Fair 74.7% |
| Panamanians | 25.0 /100 | #197 | Fair 74.7% |
| Immigrants | Nigeria | 24.2 /100 | #198 | Fair 74.7% |
| Taiwanese | 23.2 /100 | #199 | Fair 74.7% |
| Nigerians | 21.9 /100 | #200 | Fair 74.7% |
| Choctaw | 21.4 /100 | #201 | Fair 74.7% |
Demographics Similar to Immigrants from Syria by In Labor Force | Age 20-24
In terms of in labor force | age 20-24, the demographic groups most similar to Immigrants from Syria are Immigrants from South Central Asia (74.0%, a difference of 0.010%), Thai (74.0%, a difference of 0.030%), Turkish (73.9%, a difference of 0.030%), Immigrants from Senegal (74.0%, a difference of 0.040%), and Immigrants from Sri Lanka (74.0%, a difference of 0.070%).
| Demographics | Rating | Rank | In Labor Force | Age 20-24 |
| Immigrants | France | 3.3 /100 | #236 | Tragic 74.1% |
| Bermudans | 3.2 /100 | #237 | Tragic 74.1% |
| Immigrants | Japan | 3.0 /100 | #238 | Tragic 74.1% |
| Immigrants | Latin America | 2.7 /100 | #239 | Tragic 74.1% |
| Immigrants | Sri Lanka | 2.3 /100 | #240 | Tragic 74.0% |
| Immigrants | Senegal | 2.1 /100 | #241 | Tragic 74.0% |
| Thais | 2.1 /100 | #242 | Tragic 74.0% |
| Immigrants | Syria | 1.9 /100 | #243 | Tragic 74.0% |
| Immigrants | South Central Asia | 1.9 /100 | #244 | Tragic 74.0% |
| Turks | 1.8 /100 | #245 | Tragic 73.9% |
| Immigrants | Panama | 1.6 /100 | #246 | Tragic 73.9% |
| Colville | 1.5 /100 | #247 | Tragic 73.9% |
| Immigrants | Saudi Arabia | 1.5 /100 | #248 | Tragic 73.9% |
| Blacks/African Americans | 1.3 /100 | #249 | Tragic 73.9% |
| Immigrants | Belgium | 1.3 /100 | #250 | Tragic 73.9% |