Assyrian/Chaldean/Syriac vs Immigrants from Syria In Labor Force | Age 20-24
COMPARE
Assyrian/Chaldean/Syriac
Immigrants from Syria
In Labor Force | Age 20-24
In Labor Force | Age 20-24 Comparison
Assyrians/Chaldeans/Syriacs
Immigrants from Syria
75.9%
IN LABOR FORCE | AGE 20-24
94.9/ 100
METRIC RATING
117th/ 347
METRIC RANK
74.0%
IN LABOR FORCE | AGE 20-24
1.9/ 100
METRIC RATING
243rd/ 347
METRIC RANK
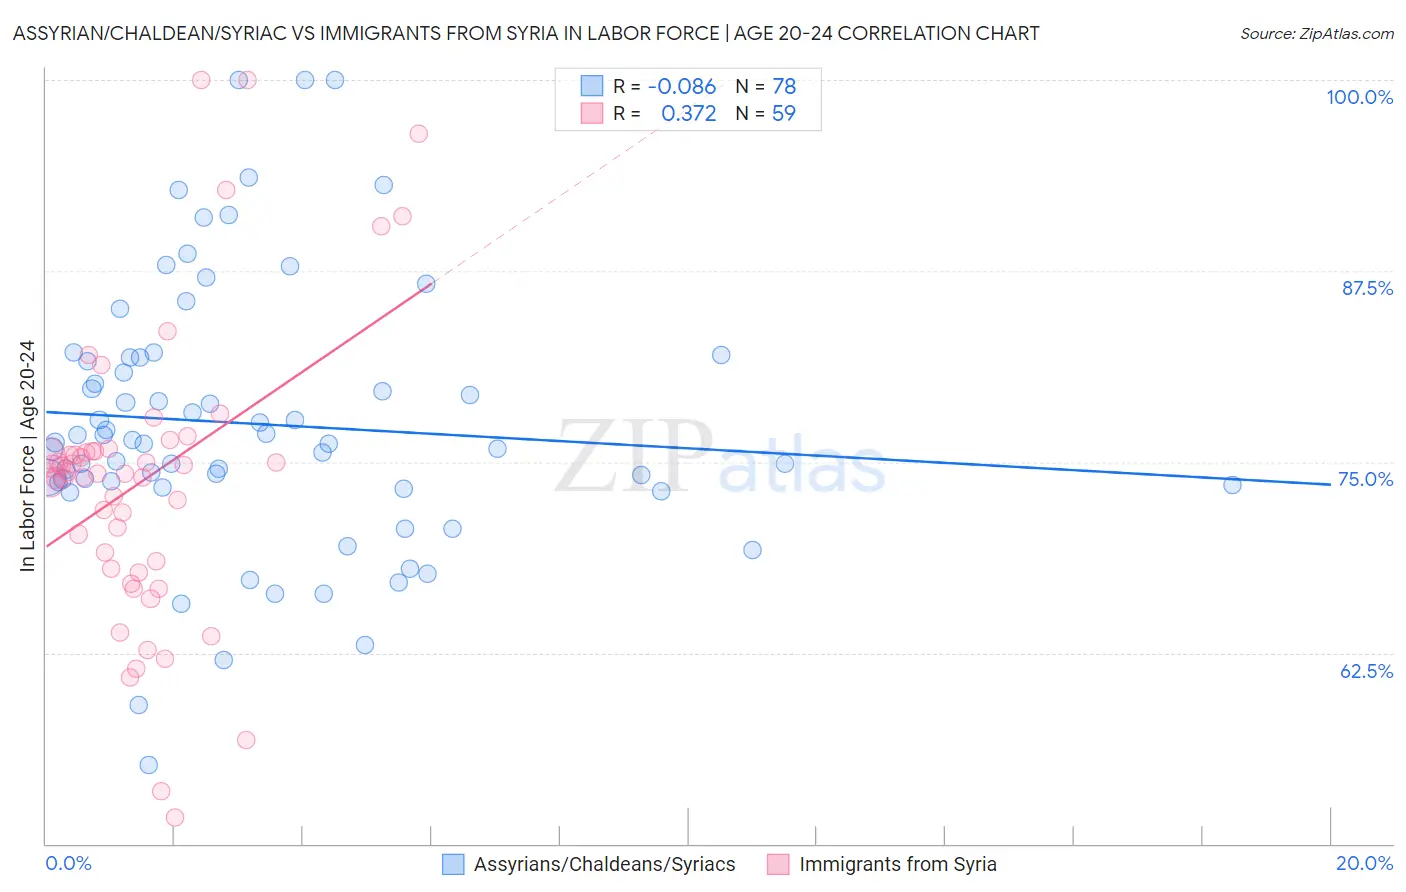
Assyrian/Chaldean/Syriac vs Immigrants from Syria In Labor Force | Age 20-24 Correlation Chart
The statistical analysis conducted on geographies consisting of 110,301,769 people shows a slight negative correlation between the proportion of Assyrians/Chaldeans/Syriacs and labor force participation rate among population between the ages 20 and 24 in the United States with a correlation coefficient (R) of -0.086 and weighted average of 75.9%. Similarly, the statistical analysis conducted on geographies consisting of 174,096,608 people shows a mild positive correlation between the proportion of Immigrants from Syria and labor force participation rate among population between the ages 20 and 24 in the United States with a correlation coefficient (R) of 0.372 and weighted average of 74.0%, a difference of 2.5%.
In Labor Force | Age 20-24 Correlation Summary
| Measurement | Assyrian/Chaldean/Syriac | Immigrants from Syria |
| Minimum | 55.2% | 51.7% |
| Maximum | 100.0% | 100.0% |
| Range | 44.8% | 48.3% |
| Mean | 77.5% | 73.8% |
| Median | 76.3% | 74.2% |
| Interquartile 25% (IQ1) | 73.5% | 68.0% |
| Interquartile 75% (IQ3) | 81.9% | 75.7% |
| Interquartile Range (IQR) | 8.4% | 7.7% |
| Standard Deviation (Sample) | 8.8% | 9.7% |
| Standard Deviation (Population) | 8.7% | 9.6% |
Similar Demographics by In Labor Force | Age 20-24
Demographics Similar to Assyrians/Chaldeans/Syriacs by In Labor Force | Age 20-24
In terms of in labor force | age 20-24, the demographic groups most similar to Assyrians/Chaldeans/Syriacs are Alaska Native (75.9%, a difference of 0.010%), Immigrants from North America (75.9%, a difference of 0.010%), Spanish American (75.8%, a difference of 0.010%), Immigrants from Portugal (75.8%, a difference of 0.010%), and Immigrants from Zimbabwe (75.9%, a difference of 0.020%).
| Demographics | Rating | Rank | In Labor Force | Age 20-24 |
| Immigrants | Morocco | 95.8 /100 | #110 | Exceptional 75.9% |
| Ukrainians | 95.7 /100 | #111 | Exceptional 75.9% |
| Immigrants | Canada | 95.6 /100 | #112 | Exceptional 75.9% |
| Immigrants | Netherlands | 95.3 /100 | #113 | Exceptional 75.9% |
| Immigrants | Zimbabwe | 95.1 /100 | #114 | Exceptional 75.9% |
| Alaska Natives | 95.1 /100 | #115 | Exceptional 75.9% |
| Immigrants | North America | 95.0 /100 | #116 | Exceptional 75.9% |
| Assyrians/Chaldeans/Syriacs | 94.9 /100 | #117 | Exceptional 75.9% |
| Spanish Americans | 94.8 /100 | #118 | Exceptional 75.8% |
| Immigrants | Portugal | 94.8 /100 | #119 | Exceptional 75.8% |
| Immigrants | Africa | 94.6 /100 | #120 | Exceptional 75.8% |
| Immigrants | Serbia | 94.3 /100 | #121 | Exceptional 75.8% |
| Pakistanis | 94.1 /100 | #122 | Exceptional 75.8% |
| Immigrants | Bulgaria | 94.1 /100 | #123 | Exceptional 75.8% |
| Immigrants | Sierra Leone | 93.8 /100 | #124 | Exceptional 75.8% |
Demographics Similar to Immigrants from Syria by In Labor Force | Age 20-24
In terms of in labor force | age 20-24, the demographic groups most similar to Immigrants from Syria are Immigrants from South Central Asia (74.0%, a difference of 0.010%), Thai (74.0%, a difference of 0.030%), Turkish (73.9%, a difference of 0.030%), Immigrants from Senegal (74.0%, a difference of 0.040%), and Immigrants from Sri Lanka (74.0%, a difference of 0.070%).
| Demographics | Rating | Rank | In Labor Force | Age 20-24 |
| Immigrants | France | 3.3 /100 | #236 | Tragic 74.1% |
| Bermudans | 3.2 /100 | #237 | Tragic 74.1% |
| Immigrants | Japan | 3.0 /100 | #238 | Tragic 74.1% |
| Immigrants | Latin America | 2.7 /100 | #239 | Tragic 74.1% |
| Immigrants | Sri Lanka | 2.3 /100 | #240 | Tragic 74.0% |
| Immigrants | Senegal | 2.1 /100 | #241 | Tragic 74.0% |
| Thais | 2.1 /100 | #242 | Tragic 74.0% |
| Immigrants | Syria | 1.9 /100 | #243 | Tragic 74.0% |
| Immigrants | South Central Asia | 1.9 /100 | #244 | Tragic 74.0% |
| Turks | 1.8 /100 | #245 | Tragic 73.9% |
| Immigrants | Panama | 1.6 /100 | #246 | Tragic 73.9% |
| Colville | 1.5 /100 | #247 | Tragic 73.9% |
| Immigrants | Saudi Arabia | 1.5 /100 | #248 | Tragic 73.9% |
| Blacks/African Americans | 1.3 /100 | #249 | Tragic 73.9% |
| Immigrants | Belgium | 1.3 /100 | #250 | Tragic 73.9% |