Indonesian vs Portuguese In Labor Force | Age > 16
COMPARE
Indonesian
Portuguese
In Labor Force | Age > 16
In Labor Force | Age > 16 Comparison
Indonesians
Portuguese
66.3%
IN LABOR FORCE | AGE > 16
99.8/ 100
METRIC RATING
62nd/ 347
METRIC RANK
64.4%
IN LABOR FORCE | AGE > 16
1.6/ 100
METRIC RATING
251st/ 347
METRIC RANK
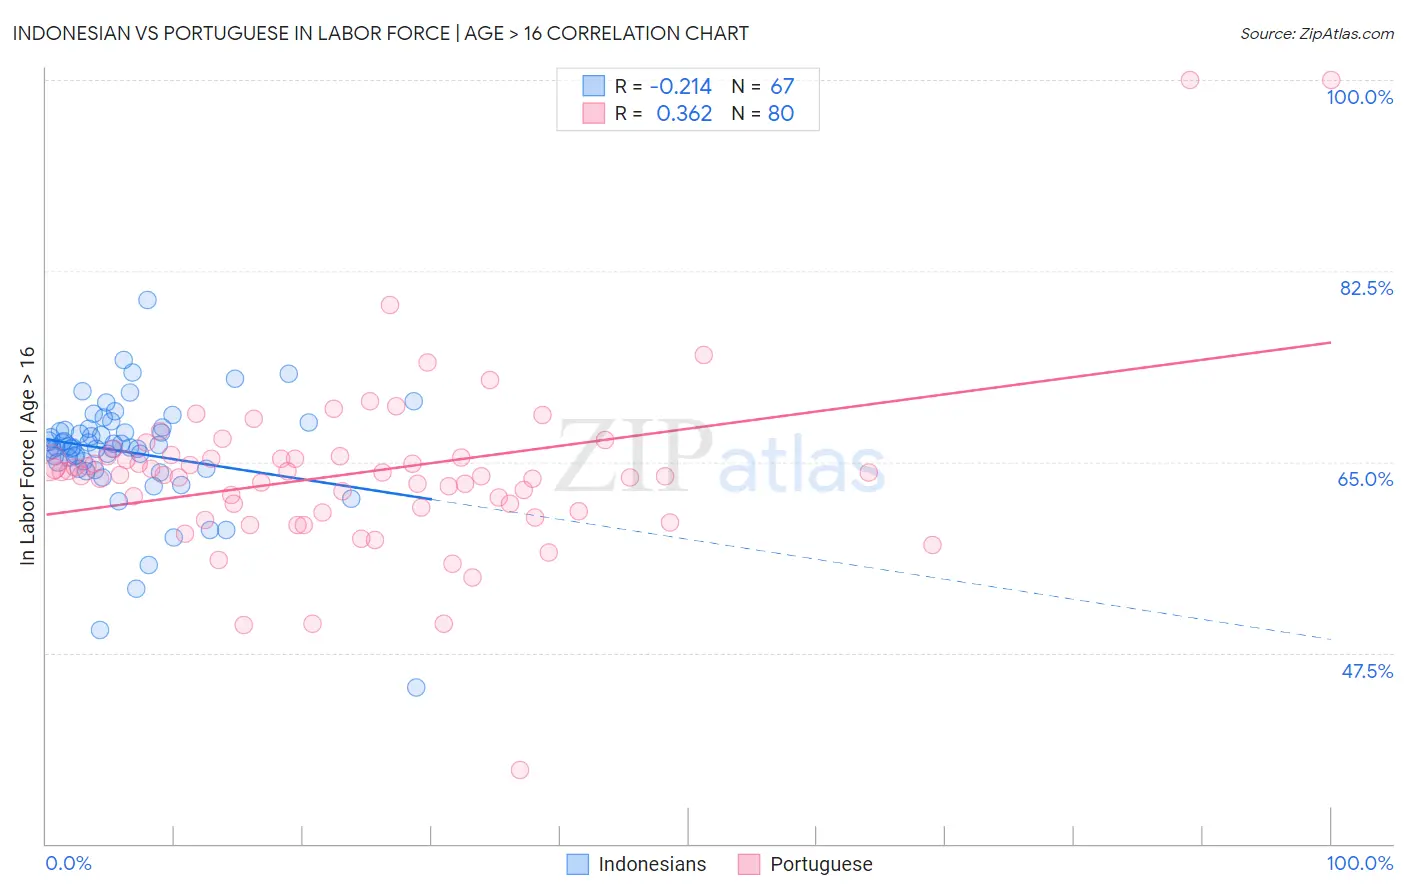
Indonesian vs Portuguese In Labor Force | Age > 16 Correlation Chart
The statistical analysis conducted on geographies consisting of 162,740,324 people shows a weak negative correlation between the proportion of Indonesians and labor force participation rate among population ages 16 and over in the United States with a correlation coefficient (R) of -0.214 and weighted average of 66.3%. Similarly, the statistical analysis conducted on geographies consisting of 450,362,243 people shows a mild positive correlation between the proportion of Portuguese and labor force participation rate among population ages 16 and over in the United States with a correlation coefficient (R) of 0.362 and weighted average of 64.4%, a difference of 3.0%.
In Labor Force | Age > 16 Correlation Summary
| Measurement | Indonesian | Portuguese |
| Minimum | 44.3% | 36.8% |
| Maximum | 79.8% | 100.0% |
| Range | 35.5% | 63.2% |
| Mean | 65.9% | 64.0% |
| Median | 66.3% | 63.8% |
| Interquartile 25% (IQ1) | 64.4% | 60.7% |
| Interquartile 75% (IQ3) | 68.0% | 65.4% |
| Interquartile Range (IQR) | 3.6% | 4.8% |
| Standard Deviation (Sample) | 5.3% | 8.2% |
| Standard Deviation (Population) | 5.3% | 8.2% |
Similar Demographics by In Labor Force | Age > 16
Demographics Similar to Indonesians by In Labor Force | Age > 16
In terms of in labor force | age > 16, the demographic groups most similar to Indonesians are Immigrants from Peru (66.3%, a difference of 0.0%), Immigrants from Burma/Myanmar (66.3%, a difference of 0.0%), Immigrants from Turkey (66.3%, a difference of 0.030%), Venezuelan (66.3%, a difference of 0.040%), and Peruvian (66.3%, a difference of 0.040%).
| Demographics | Rating | Rank | In Labor Force | Age > 16 |
| Immigrants | Venezuela | 99.9 /100 | #55 | Exceptional 66.4% |
| Immigrants | Senegal | 99.9 /100 | #56 | Exceptional 66.4% |
| Bulgarians | 99.9 /100 | #57 | Exceptional 66.4% |
| Immigrants | Saudi Arabia | 99.9 /100 | #58 | Exceptional 66.3% |
| Immigrants | Turkey | 99.9 /100 | #59 | Exceptional 66.3% |
| Immigrants | Peru | 99.8 /100 | #60 | Exceptional 66.3% |
| Immigrants | Burma/Myanmar | 99.8 /100 | #61 | Exceptional 66.3% |
| Indonesians | 99.8 /100 | #62 | Exceptional 66.3% |
| Venezuelans | 99.8 /100 | #63 | Exceptional 66.3% |
| Peruvians | 99.8 /100 | #64 | Exceptional 66.3% |
| Sri Lankans | 99.8 /100 | #65 | Exceptional 66.3% |
| Jordanians | 99.8 /100 | #66 | Exceptional 66.3% |
| Egyptians | 99.8 /100 | #67 | Exceptional 66.2% |
| Immigrants | Egypt | 99.7 /100 | #68 | Exceptional 66.2% |
| Sub-Saharan Africans | 99.7 /100 | #69 | Exceptional 66.2% |
Demographics Similar to Portuguese by In Labor Force | Age > 16
In terms of in labor force | age > 16, the demographic groups most similar to Portuguese are British West Indian (64.4%, a difference of 0.020%), German (64.4%, a difference of 0.030%), Immigrants from Dominican Republic (64.4%, a difference of 0.030%), Czechoslovakian (64.3%, a difference of 0.040%), and Immigrants from Uzbekistan (64.3%, a difference of 0.040%).
| Demographics | Rating | Rank | In Labor Force | Age > 16 |
| Tsimshian | 3.1 /100 | #244 | Tragic 64.5% |
| West Indians | 3.0 /100 | #245 | Tragic 64.5% |
| Immigrants | Caribbean | 2.3 /100 | #246 | Tragic 64.4% |
| Swiss | 2.1 /100 | #247 | Tragic 64.4% |
| Immigrants | Barbados | 2.1 /100 | #248 | Tragic 64.4% |
| Germans | 1.8 /100 | #249 | Tragic 64.4% |
| British West Indians | 1.8 /100 | #250 | Tragic 64.4% |
| Portuguese | 1.6 /100 | #251 | Tragic 64.4% |
| Immigrants | Dominican Republic | 1.5 /100 | #252 | Tragic 64.4% |
| Czechoslovakians | 1.4 /100 | #253 | Tragic 64.3% |
| Immigrants | Uzbekistan | 1.4 /100 | #254 | Tragic 64.3% |
| Hispanics or Latinos | 1.1 /100 | #255 | Tragic 64.3% |
| Immigrants | Mexico | 1.0 /100 | #256 | Tragic 64.3% |
| Inupiat | 0.8 /100 | #257 | Tragic 64.3% |
| Immigrants | Scotland | 0.8 /100 | #258 | Tragic 64.2% |