Indonesian vs Portuguese Child Poverty Among Boys Under 16
COMPARE
Indonesian
Portuguese
Child Poverty Among Boys Under 16
Child Poverty Among Boys Under 16 Comparison
Indonesians
Portuguese
20.8%
CHILD POVERTY AMONG BOYS UNDER 16
0.0/ 100
METRIC RATING
296th/ 347
METRIC RANK
15.5%
CHILD POVERTY AMONG BOYS UNDER 16
87.5/ 100
METRIC RATING
135th/ 347
METRIC RANK
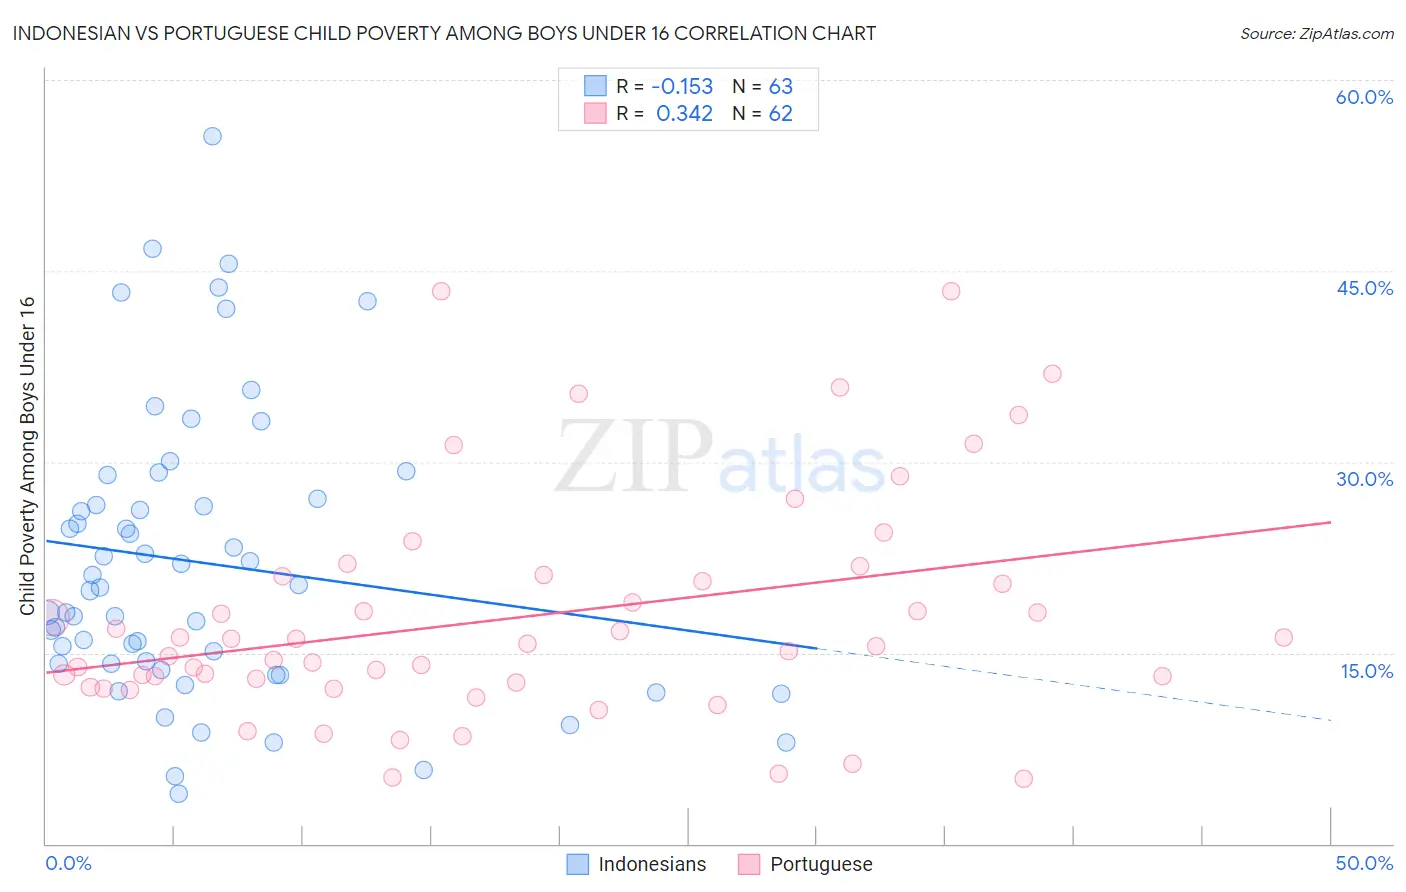
Indonesian vs Portuguese Child Poverty Among Boys Under 16 Correlation Chart
The statistical analysis conducted on geographies consisting of 161,767,910 people shows a poor negative correlation between the proportion of Indonesians and poverty level among boys under the age of 16 in the United States with a correlation coefficient (R) of -0.153 and weighted average of 20.8%. Similarly, the statistical analysis conducted on geographies consisting of 440,037,497 people shows a mild positive correlation between the proportion of Portuguese and poverty level among boys under the age of 16 in the United States with a correlation coefficient (R) of 0.342 and weighted average of 15.5%, a difference of 33.8%.
Child Poverty Among Boys Under 16 Correlation Summary
| Measurement | Indonesian | Portuguese |
| Minimum | 3.9% | 5.1% |
| Maximum | 55.6% | 43.4% |
| Range | 51.7% | 38.3% |
| Mean | 22.1% | 17.8% |
| Median | 20.1% | 15.6% |
| Interquartile 25% (IQ1) | 14.1% | 12.6% |
| Interquartile 75% (IQ3) | 27.1% | 21.1% |
| Interquartile Range (IQR) | 13.0% | 8.4% |
| Standard Deviation (Sample) | 11.3% | 8.9% |
| Standard Deviation (Population) | 11.2% | 8.8% |
Similar Demographics by Child Poverty Among Boys Under 16
Demographics Similar to Indonesians by Child Poverty Among Boys Under 16
In terms of child poverty among boys under 16, the demographic groups most similar to Indonesians are Mexican (20.7%, a difference of 0.20%), Immigrants from Bahamas (20.7%, a difference of 0.32%), Immigrants from Senegal (20.7%, a difference of 0.44%), Yaqui (20.7%, a difference of 0.45%), and Hispanic or Latino (20.9%, a difference of 0.61%).
| Demographics | Rating | Rank | Child Poverty Among Boys Under 16 |
| Blackfeet | 0.0 /100 | #289 | Tragic 20.4% |
| Senegalese | 0.0 /100 | #290 | Tragic 20.6% |
| Immigrants | Latin America | 0.0 /100 | #291 | Tragic 20.6% |
| Yaqui | 0.0 /100 | #292 | Tragic 20.7% |
| Immigrants | Senegal | 0.0 /100 | #293 | Tragic 20.7% |
| Immigrants | Bahamas | 0.0 /100 | #294 | Tragic 20.7% |
| Mexicans | 0.0 /100 | #295 | Tragic 20.7% |
| Indonesians | 0.0 /100 | #296 | Tragic 20.8% |
| Hispanics or Latinos | 0.0 /100 | #297 | Tragic 20.9% |
| Chippewa | 0.0 /100 | #298 | Tragic 21.0% |
| Immigrants | Caribbean | 0.0 /100 | #299 | Tragic 21.0% |
| Haitians | 0.0 /100 | #300 | Tragic 21.0% |
| Guatemalans | 0.0 /100 | #301 | Tragic 21.1% |
| Somalis | 0.0 /100 | #302 | Tragic 21.1% |
| Immigrants | Haiti | 0.0 /100 | #303 | Tragic 21.3% |
Demographics Similar to Portuguese by Child Poverty Among Boys Under 16
In terms of child poverty among boys under 16, the demographic groups most similar to Portuguese are Icelander (15.5%, a difference of 0.010%), Immigrants from Spain (15.6%, a difference of 0.11%), Peruvian (15.5%, a difference of 0.17%), Welsh (15.5%, a difference of 0.21%), and Immigrants from Southern Europe (15.6%, a difference of 0.26%).
| Demographics | Rating | Rank | Child Poverty Among Boys Under 16 |
| Canadians | 90.6 /100 | #128 | Exceptional 15.4% |
| Immigrants | Brazil | 90.3 /100 | #129 | Exceptional 15.4% |
| Mongolians | 90.2 /100 | #130 | Exceptional 15.4% |
| Immigrants | Western Europe | 90.0 /100 | #131 | Exceptional 15.4% |
| Immigrants | Kazakhstan | 88.7 /100 | #132 | Excellent 15.5% |
| Welsh | 88.3 /100 | #133 | Excellent 15.5% |
| Peruvians | 88.1 /100 | #134 | Excellent 15.5% |
| Portuguese | 87.5 /100 | #135 | Excellent 15.5% |
| Icelanders | 87.5 /100 | #136 | Excellent 15.5% |
| Immigrants | Spain | 87.1 /100 | #137 | Excellent 15.6% |
| Immigrants | Southern Europe | 86.5 /100 | #138 | Excellent 15.6% |
| Albanians | 86.5 /100 | #139 | Excellent 15.6% |
| Immigrants | Kuwait | 85.6 /100 | #140 | Excellent 15.6% |
| Slavs | 84.5 /100 | #141 | Excellent 15.7% |
| Immigrants | Hungary | 84.1 /100 | #142 | Excellent 15.7% |