Immigrants from Zimbabwe vs Scottish In Labor Force | Age 16-19
COMPARE
Immigrants from Zimbabwe
Scottish
In Labor Force | Age 16-19
In Labor Force | Age 16-19 Comparison
Immigrants from Zimbabwe
Scottish
38.0%
IN LABOR FORCE | AGE 16-19
95.4/ 100
METRIC RATING
130th/ 347
METRIC RANK
42.0%
IN LABOR FORCE | AGE 16-19
100.0/ 100
METRIC RATING
30th/ 347
METRIC RANK
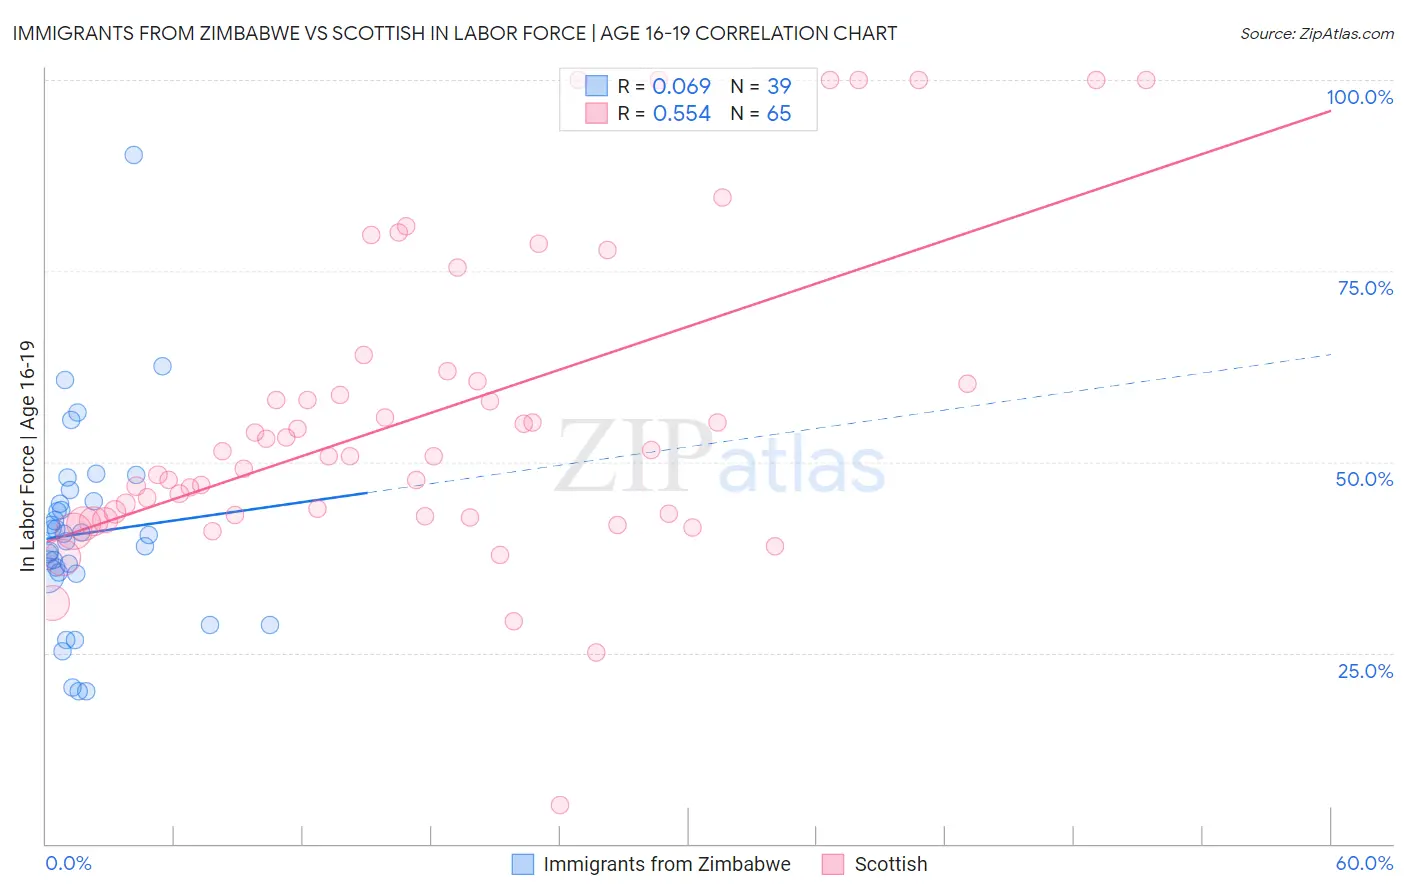
Immigrants from Zimbabwe vs Scottish In Labor Force | Age 16-19 Correlation Chart
The statistical analysis conducted on geographies consisting of 117,770,176 people shows a slight positive correlation between the proportion of Immigrants from Zimbabwe and labor force participation rate among population between the ages 16 and 19 in the United States with a correlation coefficient (R) of 0.069 and weighted average of 38.0%. Similarly, the statistical analysis conducted on geographies consisting of 562,983,292 people shows a substantial positive correlation between the proportion of Scottish and labor force participation rate among population between the ages 16 and 19 in the United States with a correlation coefficient (R) of 0.554 and weighted average of 42.0%, a difference of 10.6%.
In Labor Force | Age 16-19 Correlation Summary
| Measurement | Immigrants from Zimbabwe | Scottish |
| Minimum | 20.0% | 5.0% |
| Maximum | 90.2% | 100.0% |
| Range | 70.2% | 95.0% |
| Mean | 40.6% | 56.2% |
| Median | 40.4% | 50.8% |
| Interquartile 25% (IQ1) | 35.3% | 42.9% |
| Interquartile 75% (IQ3) | 44.9% | 61.2% |
| Interquartile Range (IQR) | 9.6% | 18.3% |
| Standard Deviation (Sample) | 13.0% | 20.5% |
| Standard Deviation (Population) | 12.8% | 20.4% |
Similar Demographics by In Labor Force | Age 16-19
Demographics Similar to Immigrants from Zimbabwe by In Labor Force | Age 16-19
In terms of in labor force | age 16-19, the demographic groups most similar to Immigrants from Zimbabwe are Spaniard (38.0%, a difference of 0.030%), New Zealander (38.0%, a difference of 0.050%), African (38.0%, a difference of 0.060%), Choctaw (38.0%, a difference of 0.060%), and Immigrants from Austria (37.9%, a difference of 0.090%).
| Demographics | Rating | Rank | In Labor Force | Age 16-19 |
| Seminole | 96.7 /100 | #123 | Exceptional 38.1% |
| Immigrants | England | 96.4 /100 | #124 | Exceptional 38.1% |
| Immigrants | Africa | 96.1 /100 | #125 | Exceptional 38.0% |
| Africans | 95.6 /100 | #126 | Exceptional 38.0% |
| Choctaw | 95.6 /100 | #127 | Exceptional 38.0% |
| New Zealanders | 95.6 /100 | #128 | Exceptional 38.0% |
| Spaniards | 95.5 /100 | #129 | Exceptional 38.0% |
| Immigrants | Zimbabwe | 95.4 /100 | #130 | Exceptional 38.0% |
| Immigrants | Austria | 95.0 /100 | #131 | Exceptional 37.9% |
| Immigrants | Oceania | 94.7 /100 | #132 | Exceptional 37.9% |
| Cheyenne | 94.6 /100 | #133 | Exceptional 37.9% |
| Immigrants | Netherlands | 93.7 /100 | #134 | Exceptional 37.8% |
| Macedonians | 93.4 /100 | #135 | Exceptional 37.8% |
| Australians | 93.2 /100 | #136 | Exceptional 37.8% |
| Cajuns | 93.2 /100 | #137 | Exceptional 37.8% |
Demographics Similar to Scottish by In Labor Force | Age 16-19
In terms of in labor force | age 16-19, the demographic groups most similar to Scottish are Irish (42.0%, a difference of 0.070%), Czechoslovakian (41.9%, a difference of 0.27%), French (42.1%, a difference of 0.28%), Polish (42.1%, a difference of 0.33%), and Liberian (41.8%, a difference of 0.41%).
| Demographics | Rating | Rank | In Labor Force | Age 16-19 |
| Slovaks | 100.0 /100 | #23 | Exceptional 42.6% |
| Bangladeshis | 100.0 /100 | #24 | Exceptional 42.5% |
| German Russians | 100.0 /100 | #25 | Exceptional 42.4% |
| English | 100.0 /100 | #26 | Exceptional 42.4% |
| Welsh | 100.0 /100 | #27 | Exceptional 42.3% |
| Poles | 100.0 /100 | #28 | Exceptional 42.1% |
| French | 100.0 /100 | #29 | Exceptional 42.1% |
| Scottish | 100.0 /100 | #30 | Exceptional 42.0% |
| Irish | 100.0 /100 | #31 | Exceptional 42.0% |
| Czechoslovakians | 100.0 /100 | #32 | Exceptional 41.9% |
| Liberians | 100.0 /100 | #33 | Exceptional 41.8% |
| Immigrants | Bosnia and Herzegovina | 100.0 /100 | #34 | Exceptional 41.8% |
| Yugoslavians | 100.0 /100 | #35 | Exceptional 41.8% |
| Immigrants | Azores | 100.0 /100 | #36 | Exceptional 41.7% |
| Immigrants | Congo | 100.0 /100 | #37 | Exceptional 41.7% |