Immigrants from Zimbabwe vs Immigrants from Kazakhstan Nursery School
COMPARE
Immigrants from Zimbabwe
Immigrants from Kazakhstan
Nursery School
Nursery School Comparison
Immigrants from Zimbabwe
Immigrants from Kazakhstan
98.2%
NURSERY SCHOOL
94.2/ 100
METRIC RATING
121st/ 347
METRIC RANK
97.9%
NURSERY SCHOOL
37.1/ 100
METRIC RATING
187th/ 347
METRIC RANK
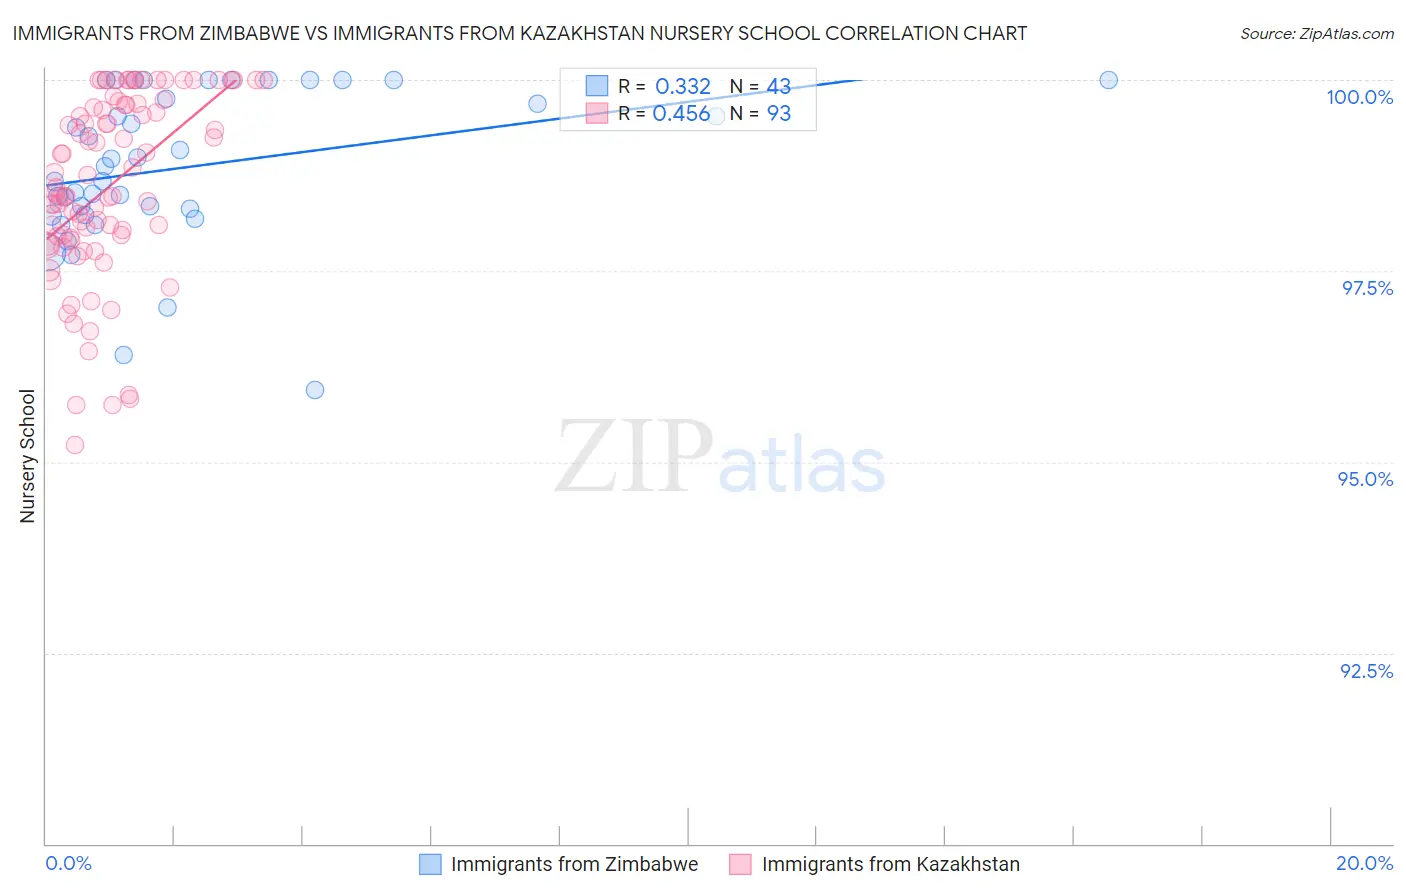
Immigrants from Zimbabwe vs Immigrants from Kazakhstan Nursery School Correlation Chart
The statistical analysis conducted on geographies consisting of 117,756,150 people shows a mild positive correlation between the proportion of Immigrants from Zimbabwe and percentage of population with at least nursery school education in the United States with a correlation coefficient (R) of 0.332 and weighted average of 98.2%. Similarly, the statistical analysis conducted on geographies consisting of 124,444,388 people shows a moderate positive correlation between the proportion of Immigrants from Kazakhstan and percentage of population with at least nursery school education in the United States with a correlation coefficient (R) of 0.456 and weighted average of 97.9%, a difference of 0.25%.
Nursery School Correlation Summary
| Measurement | Immigrants from Zimbabwe | Immigrants from Kazakhstan |
| Minimum | 95.9% | 95.2% |
| Maximum | 100.0% | 100.0% |
| Range | 4.1% | 4.8% |
| Mean | 98.9% | 98.6% |
| Median | 98.9% | 98.5% |
| Interquartile 25% (IQ1) | 98.2% | 97.9% |
| Interquartile 75% (IQ3) | 100.0% | 99.7% |
| Interquartile Range (IQR) | 1.8% | 1.7% |
| Standard Deviation (Sample) | 1.0% | 1.2% |
| Standard Deviation (Population) | 1.00% | 1.2% |
Similar Demographics by Nursery School
Demographics Similar to Immigrants from Zimbabwe by Nursery School
In terms of nursery school, the demographic groups most similar to Immigrants from Zimbabwe are Okinawan (98.2%, a difference of 0.0%), Immigrants from Japan (98.2%, a difference of 0.0%), Syrian (98.2%, a difference of 0.0%), Thai (98.2%, a difference of 0.010%), and Lebanese (98.2%, a difference of 0.010%).
| Demographics | Rating | Rank | Nursery School |
| Ute | 96.4 /100 | #114 | Exceptional 98.2% |
| Iranians | 96.3 /100 | #115 | Exceptional 98.2% |
| Spanish | 95.8 /100 | #116 | Exceptional 98.2% |
| Immigrants | France | 95.6 /100 | #117 | Exceptional 98.2% |
| Yugoslavians | 95.4 /100 | #118 | Exceptional 98.2% |
| Thais | 95.0 /100 | #119 | Exceptional 98.2% |
| Okinawans | 94.5 /100 | #120 | Exceptional 98.2% |
| Immigrants | Zimbabwe | 94.2 /100 | #121 | Exceptional 98.2% |
| Immigrants | Japan | 94.0 /100 | #122 | Exceptional 98.2% |
| Syrians | 93.9 /100 | #123 | Exceptional 98.2% |
| Lebanese | 93.8 /100 | #124 | Exceptional 98.2% |
| Iroquois | 93.7 /100 | #125 | Exceptional 98.2% |
| Menominee | 93.6 /100 | #126 | Exceptional 98.2% |
| Immigrants | Saudi Arabia | 93.4 /100 | #127 | Exceptional 98.2% |
| Immigrants | Serbia | 92.4 /100 | #128 | Exceptional 98.2% |
Demographics Similar to Immigrants from Kazakhstan by Nursery School
In terms of nursery school, the demographic groups most similar to Immigrants from Kazakhstan are Portuguese (98.0%, a difference of 0.010%), Immigrants from Poland (98.0%, a difference of 0.010%), Immigrants from Belarus (98.0%, a difference of 0.010%), Immigrants from Argentina (98.0%, a difference of 0.010%), and Arab (97.9%, a difference of 0.010%).
| Demographics | Rating | Rank | Nursery School |
| Immigrants | Bosnia and Herzegovina | 45.6 /100 | #180 | Average 98.0% |
| Egyptians | 42.8 /100 | #181 | Average 98.0% |
| Paiute | 42.0 /100 | #182 | Average 98.0% |
| Portuguese | 41.8 /100 | #183 | Average 98.0% |
| Immigrants | Poland | 41.3 /100 | #184 | Average 98.0% |
| Immigrants | Belarus | 41.0 /100 | #185 | Average 98.0% |
| Immigrants | Argentina | 40.8 /100 | #186 | Average 98.0% |
| Immigrants | Kazakhstan | 37.1 /100 | #187 | Fair 97.9% |
| Arabs | 34.7 /100 | #188 | Fair 97.9% |
| Pakistanis | 34.6 /100 | #189 | Fair 97.9% |
| Panamanians | 34.3 /100 | #190 | Fair 97.9% |
| Immigrants | Taiwan | 30.6 /100 | #191 | Fair 97.9% |
| Blacks/African Americans | 29.4 /100 | #192 | Fair 97.9% |
| Paraguayans | 27.4 /100 | #193 | Fair 97.9% |
| Mongolians | 27.3 /100 | #194 | Fair 97.9% |