Immigrants from Zimbabwe vs Immigrants from Bolivia In Labor Force | Age 20-24
COMPARE
Immigrants from Zimbabwe
Immigrants from Bolivia
In Labor Force | Age 20-24
In Labor Force | Age 20-24 Comparison
Immigrants from Zimbabwe
Immigrants from Bolivia
75.9%
IN LABOR FORCE | AGE 20-24
95.1/ 100
METRIC RATING
114th/ 347
METRIC RANK
75.3%
IN LABOR FORCE | AGE 20-24
71.0/ 100
METRIC RATING
158th/ 347
METRIC RANK
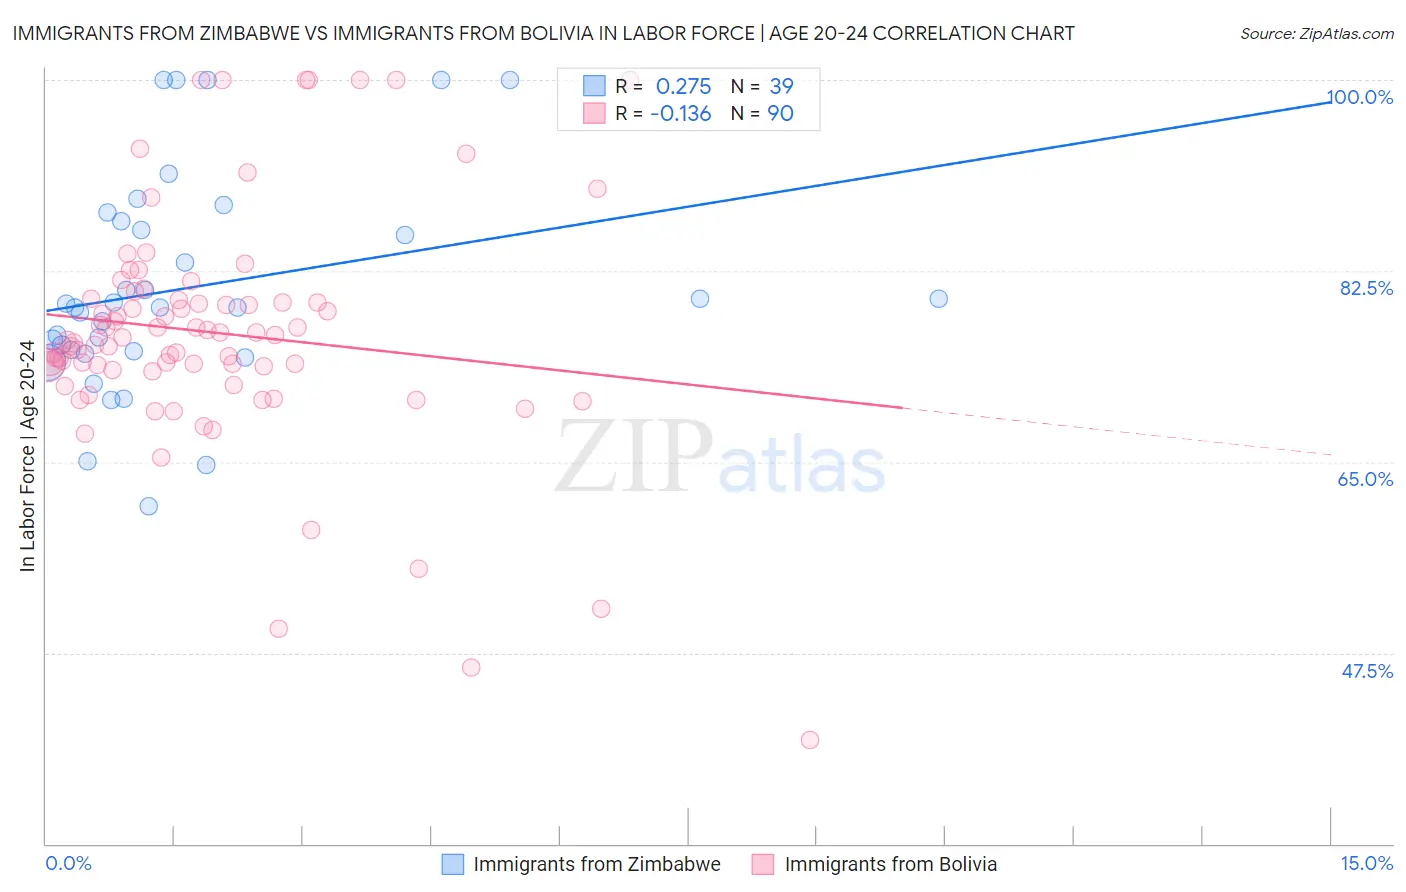
Immigrants from Zimbabwe vs Immigrants from Bolivia In Labor Force | Age 20-24 Correlation Chart
The statistical analysis conducted on geographies consisting of 117,807,327 people shows a weak positive correlation between the proportion of Immigrants from Zimbabwe and labor force participation rate among population between the ages 20 and 24 in the United States with a correlation coefficient (R) of 0.275 and weighted average of 75.9%. Similarly, the statistical analysis conducted on geographies consisting of 158,683,867 people shows a poor negative correlation between the proportion of Immigrants from Bolivia and labor force participation rate among population between the ages 20 and 24 in the United States with a correlation coefficient (R) of -0.136 and weighted average of 75.3%, a difference of 0.76%.
In Labor Force | Age 20-24 Correlation Summary
| Measurement | Immigrants from Zimbabwe | Immigrants from Bolivia |
| Minimum | 60.9% | 39.5% |
| Maximum | 100.0% | 100.0% |
| Range | 39.1% | 60.5% |
| Mean | 81.0% | 76.8% |
| Median | 79.2% | 76.3% |
| Interquartile 25% (IQ1) | 75.2% | 73.4% |
| Interquartile 75% (IQ3) | 87.0% | 79.8% |
| Interquartile Range (IQR) | 11.9% | 6.5% |
| Standard Deviation (Sample) | 9.9% | 10.9% |
| Standard Deviation (Population) | 9.7% | 10.9% |
Similar Demographics by In Labor Force | Age 20-24
Demographics Similar to Immigrants from Zimbabwe by In Labor Force | Age 20-24
In terms of in labor force | age 20-24, the demographic groups most similar to Immigrants from Zimbabwe are Alaska Native (75.9%, a difference of 0.0%), Immigrants from Netherlands (75.9%, a difference of 0.010%), Immigrants from North America (75.9%, a difference of 0.010%), Assyrian/Chaldean/Syriac (75.9%, a difference of 0.020%), and Spanish American (75.8%, a difference of 0.020%).
| Demographics | Rating | Rank | In Labor Force | Age 20-24 |
| Greeks | 96.9 /100 | #107 | Exceptional 76.0% |
| Iraqis | 96.6 /100 | #108 | Exceptional 76.0% |
| Cherokee | 95.8 /100 | #109 | Exceptional 75.9% |
| Immigrants | Morocco | 95.8 /100 | #110 | Exceptional 75.9% |
| Ukrainians | 95.7 /100 | #111 | Exceptional 75.9% |
| Immigrants | Canada | 95.6 /100 | #112 | Exceptional 75.9% |
| Immigrants | Netherlands | 95.3 /100 | #113 | Exceptional 75.9% |
| Immigrants | Zimbabwe | 95.1 /100 | #114 | Exceptional 75.9% |
| Alaska Natives | 95.1 /100 | #115 | Exceptional 75.9% |
| Immigrants | North America | 95.0 /100 | #116 | Exceptional 75.9% |
| Assyrians/Chaldeans/Syriacs | 94.9 /100 | #117 | Exceptional 75.9% |
| Spanish Americans | 94.8 /100 | #118 | Exceptional 75.8% |
| Immigrants | Portugal | 94.8 /100 | #119 | Exceptional 75.8% |
| Immigrants | Africa | 94.6 /100 | #120 | Exceptional 75.8% |
| Immigrants | Serbia | 94.3 /100 | #121 | Exceptional 75.8% |
Demographics Similar to Immigrants from Bolivia by In Labor Force | Age 20-24
In terms of in labor force | age 20-24, the demographic groups most similar to Immigrants from Bolivia are Immigrants from El Salvador (75.3%, a difference of 0.010%), Immigrants from Western Europe (75.3%, a difference of 0.010%), Guatemalan (75.3%, a difference of 0.020%), Osage (75.3%, a difference of 0.020%), and Immigrants from Guatemala (75.3%, a difference of 0.020%).
| Demographics | Rating | Rank | In Labor Force | Age 20-24 |
| Paiute | 74.1 /100 | #151 | Good 75.3% |
| Lebanese | 73.5 /100 | #152 | Good 75.3% |
| Guatemalans | 72.3 /100 | #153 | Good 75.3% |
| Osage | 72.3 /100 | #154 | Good 75.3% |
| Immigrants | Guatemala | 71.9 /100 | #155 | Good 75.3% |
| Immigrants | El Salvador | 71.7 /100 | #156 | Good 75.3% |
| Immigrants | Western Europe | 71.5 /100 | #157 | Good 75.3% |
| Immigrants | Bolivia | 71.0 /100 | #158 | Good 75.3% |
| South American Indians | 69.0 /100 | #159 | Good 75.3% |
| Japanese | 68.7 /100 | #160 | Good 75.3% |
| New Zealanders | 65.4 /100 | #161 | Good 75.2% |
| Immigrants | Romania | 64.6 /100 | #162 | Good 75.2% |
| Costa Ricans | 64.2 /100 | #163 | Good 75.2% |
| Bolivians | 64.0 /100 | #164 | Good 75.2% |
| Afghans | 63.5 /100 | #165 | Good 75.2% |