Mexican American Indian vs Immigrants from West Indies In Labor Force | Age 30-34
COMPARE
Mexican American Indian
Immigrants from West Indies
In Labor Force | Age 30-34
In Labor Force | Age 30-34 Comparison
Mexican American Indians
Immigrants from West Indies
83.2%
IN LABOR FORCE | AGE 30-34
0.0/ 100
METRIC RATING
282nd/ 347
METRIC RANK
84.5%
IN LABOR FORCE | AGE 30-34
18.1/ 100
METRIC RATING
202nd/ 347
METRIC RANK
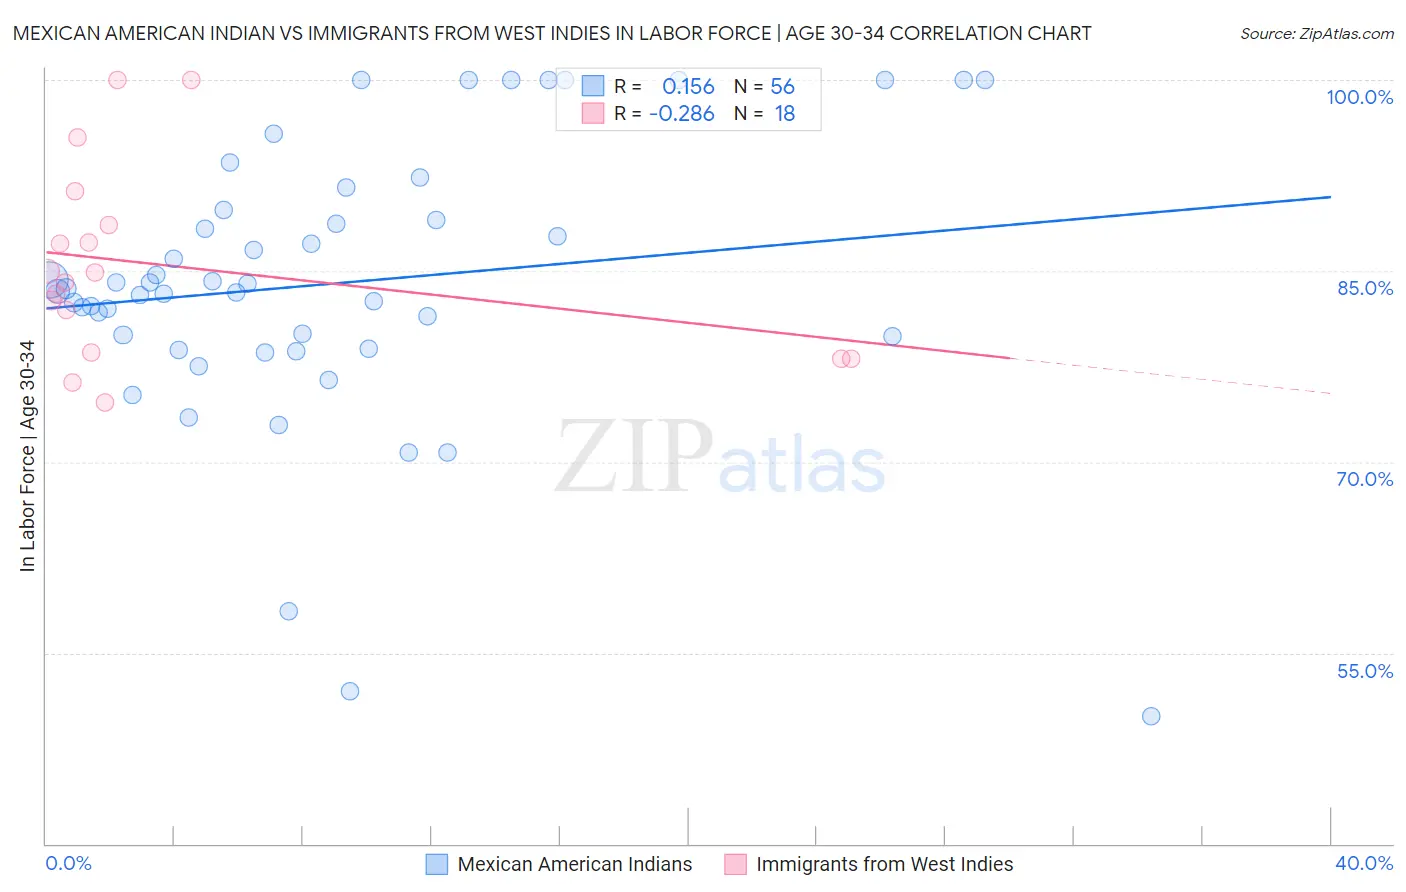
Mexican American Indian vs Immigrants from West Indies In Labor Force | Age 30-34 Correlation Chart
The statistical analysis conducted on geographies consisting of 317,534,502 people shows a poor positive correlation between the proportion of Mexican American Indians and labor force participation rate among population between the ages 30 and 34 in the United States with a correlation coefficient (R) of 0.156 and weighted average of 83.2%. Similarly, the statistical analysis conducted on geographies consisting of 72,450,455 people shows a weak negative correlation between the proportion of Immigrants from West Indies and labor force participation rate among population between the ages 30 and 34 in the United States with a correlation coefficient (R) of -0.286 and weighted average of 84.5%, a difference of 1.5%.
In Labor Force | Age 30-34 Correlation Summary
| Measurement | Mexican American Indian | Immigrants from West Indies |
| Minimum | 50.0% | 74.7% |
| Maximum | 100.0% | 100.0% |
| Range | 50.0% | 25.3% |
| Mean | 84.0% | 85.4% |
| Median | 83.5% | 84.5% |
| Interquartile 25% (IQ1) | 79.4% | 78.6% |
| Interquartile 75% (IQ3) | 89.4% | 88.6% |
| Interquartile Range (IQR) | 10.0% | 10.0% |
| Standard Deviation (Sample) | 10.9% | 7.5% |
| Standard Deviation (Population) | 10.8% | 7.3% |
Similar Demographics by In Labor Force | Age 30-34
Demographics Similar to Mexican American Indians by In Labor Force | Age 30-34
In terms of in labor force | age 30-34, the demographic groups most similar to Mexican American Indians are Assyrian/Chaldean/Syriac (83.2%, a difference of 0.010%), Samoan (83.3%, a difference of 0.040%), Immigrants from Belize (83.2%, a difference of 0.070%), Cree (83.2%, a difference of 0.070%), and Immigrants from Latin America (83.1%, a difference of 0.12%).
| Demographics | Rating | Rank | In Labor Force | Age 30-34 |
| Immigrants | Grenada | 0.0 /100 | #275 | Tragic 83.5% |
| Tongans | 0.0 /100 | #276 | Tragic 83.5% |
| Delaware | 0.0 /100 | #277 | Tragic 83.5% |
| Fijians | 0.0 /100 | #278 | Tragic 83.4% |
| Immigrants | Fiji | 0.0 /100 | #279 | Tragic 83.4% |
| Africans | 0.0 /100 | #280 | Tragic 83.4% |
| Samoans | 0.0 /100 | #281 | Tragic 83.3% |
| Mexican American Indians | 0.0 /100 | #282 | Tragic 83.2% |
| Assyrians/Chaldeans/Syriacs | 0.0 /100 | #283 | Tragic 83.2% |
| Immigrants | Belize | 0.0 /100 | #284 | Tragic 83.2% |
| Cree | 0.0 /100 | #285 | Tragic 83.2% |
| Immigrants | Latin America | 0.0 /100 | #286 | Tragic 83.1% |
| Native Hawaiians | 0.0 /100 | #287 | Tragic 83.0% |
| Central American Indians | 0.0 /100 | #288 | Tragic 83.0% |
| Hawaiians | 0.0 /100 | #289 | Tragic 83.0% |
Demographics Similar to Immigrants from West Indies by In Labor Force | Age 30-34
In terms of in labor force | age 30-34, the demographic groups most similar to Immigrants from West Indies are Trinidadian and Tobagonian (84.5%, a difference of 0.0%), Immigrants from Thailand (84.5%, a difference of 0.010%), Subsaharan African (84.5%, a difference of 0.010%), Dutch (84.5%, a difference of 0.020%), and Canadian (84.4%, a difference of 0.030%).
| Demographics | Rating | Rank | In Labor Force | Age 30-34 |
| Koreans | 23.2 /100 | #195 | Fair 84.5% |
| British | 22.9 /100 | #196 | Fair 84.5% |
| Immigrants | Syria | 21.9 /100 | #197 | Fair 84.5% |
| Dutch | 20.2 /100 | #198 | Fair 84.5% |
| Immigrants | Thailand | 19.1 /100 | #199 | Poor 84.5% |
| Sub-Saharan Africans | 19.0 /100 | #200 | Poor 84.5% |
| Trinidadians and Tobagonians | 18.2 /100 | #201 | Poor 84.5% |
| Immigrants | West Indies | 18.1 /100 | #202 | Poor 84.5% |
| Canadians | 15.4 /100 | #203 | Poor 84.4% |
| Ecuadorians | 14.2 /100 | #204 | Poor 84.4% |
| French | 13.8 /100 | #205 | Poor 84.4% |
| Lebanese | 10.6 /100 | #206 | Poor 84.4% |
| Bangladeshis | 9.4 /100 | #207 | Tragic 84.3% |
| Arabs | 8.9 /100 | #208 | Tragic 84.3% |
| Jamaicans | 8.8 /100 | #209 | Tragic 84.3% |