Dutch West Indian vs Immigrants from North America In Labor Force | Age 30-34
COMPARE
Dutch West Indian
Immigrants from North America
In Labor Force | Age 30-34
In Labor Force | Age 30-34 Comparison
Dutch West Indians
Immigrants from North America
81.0%
IN LABOR FORCE | AGE 30-34
0.0/ 100
METRIC RATING
325th/ 347
METRIC RANK
84.6%
IN LABOR FORCE | AGE 30-34
33.3/ 100
METRIC RATING
184th/ 347
METRIC RANK
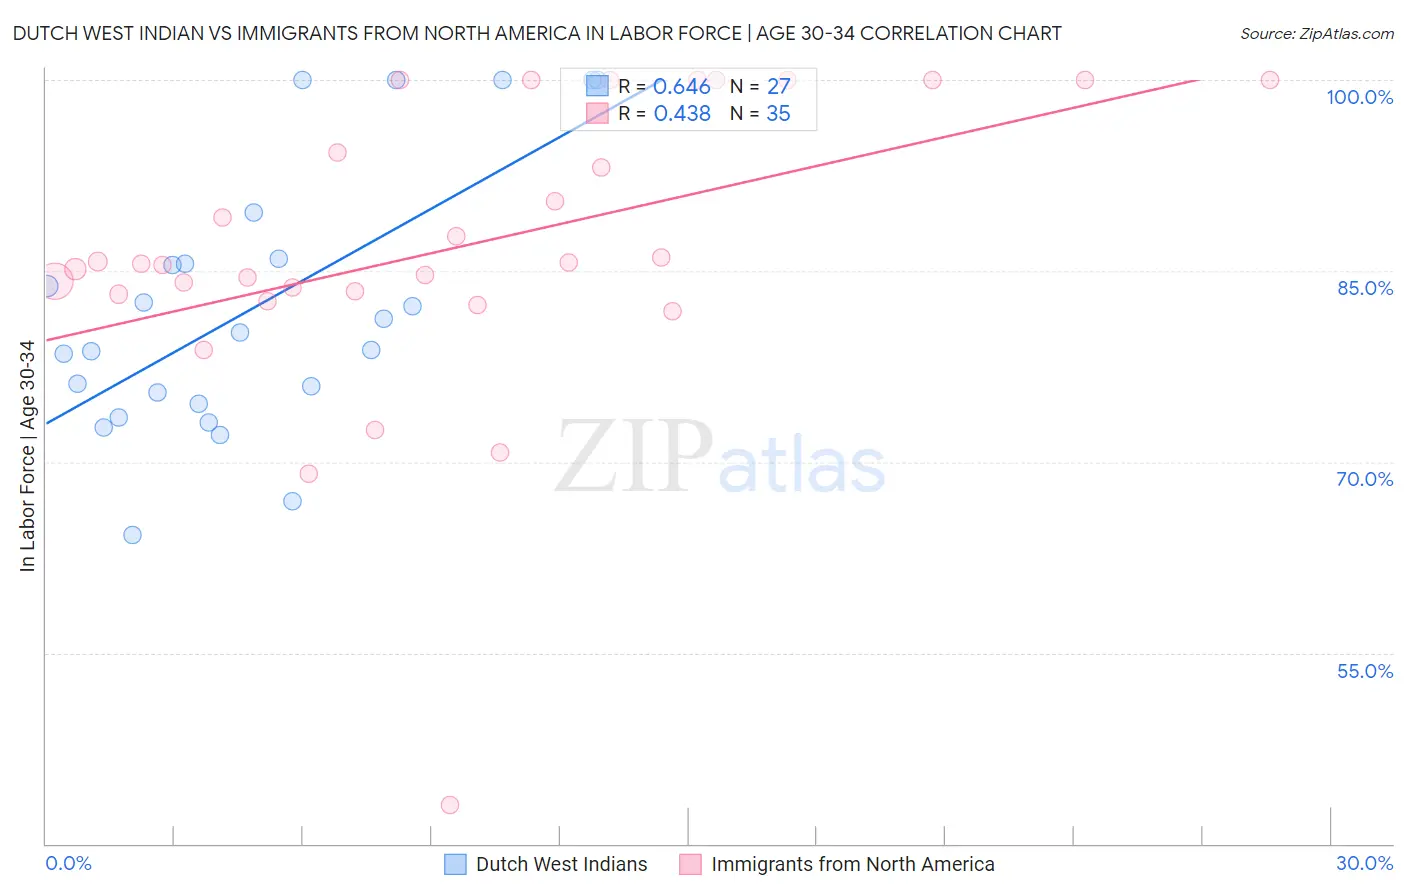
Dutch West Indian vs Immigrants from North America In Labor Force | Age 30-34 Correlation Chart
The statistical analysis conducted on geographies consisting of 85,757,980 people shows a significant positive correlation between the proportion of Dutch West Indians and labor force participation rate among population between the ages 30 and 34 in the United States with a correlation coefficient (R) of 0.646 and weighted average of 81.0%. Similarly, the statistical analysis conducted on geographies consisting of 462,059,236 people shows a moderate positive correlation between the proportion of Immigrants from North America and labor force participation rate among population between the ages 30 and 34 in the United States with a correlation coefficient (R) of 0.438 and weighted average of 84.6%, a difference of 4.4%.
In Labor Force | Age 30-34 Correlation Summary
| Measurement | Dutch West Indian | Immigrants from North America |
| Minimum | 64.3% | 43.1% |
| Maximum | 100.0% | 100.0% |
| Range | 35.7% | 56.9% |
| Mean | 82.1% | 86.8% |
| Median | 80.2% | 85.6% |
| Interquartile 25% (IQ1) | 74.5% | 83.2% |
| Interquartile 75% (IQ3) | 86.0% | 100.0% |
| Interquartile Range (IQR) | 11.4% | 16.8% |
| Standard Deviation (Sample) | 10.4% | 11.6% |
| Standard Deviation (Population) | 10.2% | 11.4% |
Similar Demographics by In Labor Force | Age 30-34
Demographics Similar to Dutch West Indians by In Labor Force | Age 30-34
In terms of in labor force | age 30-34, the demographic groups most similar to Dutch West Indians are Cheyenne (81.1%, a difference of 0.15%), Paiute (81.2%, a difference of 0.19%), Seminole (80.8%, a difference of 0.22%), Puerto Rican (81.2%, a difference of 0.23%), and Alaska Native (81.3%, a difference of 0.39%).
| Demographics | Rating | Rank | In Labor Force | Age 30-34 |
| Choctaw | 0.0 /100 | #318 | Tragic 81.4% |
| Shoshone | 0.0 /100 | #319 | Tragic 81.4% |
| Yaqui | 0.0 /100 | #320 | Tragic 81.4% |
| Alaska Natives | 0.0 /100 | #321 | Tragic 81.3% |
| Puerto Ricans | 0.0 /100 | #322 | Tragic 81.2% |
| Paiute | 0.0 /100 | #323 | Tragic 81.2% |
| Cheyenne | 0.0 /100 | #324 | Tragic 81.1% |
| Dutch West Indians | 0.0 /100 | #325 | Tragic 81.0% |
| Seminole | 0.0 /100 | #326 | Tragic 80.8% |
| Colville | 0.0 /100 | #327 | Tragic 80.7% |
| Sioux | 0.0 /100 | #328 | Tragic 80.4% |
| Creek | 0.0 /100 | #329 | Tragic 80.4% |
| Pueblo | 0.0 /100 | #330 | Tragic 80.0% |
| Houma | 0.0 /100 | #331 | Tragic 79.9% |
| Kiowa | 0.0 /100 | #332 | Tragic 79.8% |
Demographics Similar to Immigrants from North America by In Labor Force | Age 30-34
In terms of in labor force | age 30-34, the demographic groups most similar to Immigrants from North America are Immigrants from Canada (84.6%, a difference of 0.010%), Immigrants from Philippines (84.6%, a difference of 0.010%), Barbadian (84.6%, a difference of 0.030%), Immigrants from Congo (84.6%, a difference of 0.030%), and Costa Rican (84.6%, a difference of 0.030%).
| Demographics | Rating | Rank | In Labor Force | Age 30-34 |
| Laotians | 46.9 /100 | #177 | Average 84.7% |
| Okinawans | 44.1 /100 | #178 | Average 84.6% |
| Immigrants | Nigeria | 42.5 /100 | #179 | Average 84.6% |
| Immigrants | Netherlands | 42.1 /100 | #180 | Average 84.6% |
| Moroccans | 40.3 /100 | #181 | Average 84.6% |
| Barbadians | 36.7 /100 | #182 | Fair 84.6% |
| Immigrants | Canada | 35.0 /100 | #183 | Fair 84.6% |
| Immigrants | North America | 33.3 /100 | #184 | Fair 84.6% |
| Immigrants | Philippines | 31.5 /100 | #185 | Fair 84.6% |
| Immigrants | Congo | 29.7 /100 | #186 | Fair 84.6% |
| Costa Ricans | 29.6 /100 | #187 | Fair 84.6% |
| Taiwanese | 29.4 /100 | #188 | Fair 84.6% |
| Nigerians | 28.9 /100 | #189 | Fair 84.5% |
| Immigrants | Zaire | 25.8 /100 | #190 | Fair 84.5% |
| Hungarians | 24.8 /100 | #191 | Fair 84.5% |