Tongan vs Afghan In Labor Force | Age 30-34
COMPARE
Tongan
Afghan
In Labor Force | Age 30-34
In Labor Force | Age 30-34 Comparison
Tongans
Afghans
83.5%
IN LABOR FORCE | AGE 30-34
0.0/ 100
METRIC RATING
276th/ 347
METRIC RANK
84.7%
IN LABOR FORCE | AGE 30-34
55.2/ 100
METRIC RATING
166th/ 347
METRIC RANK
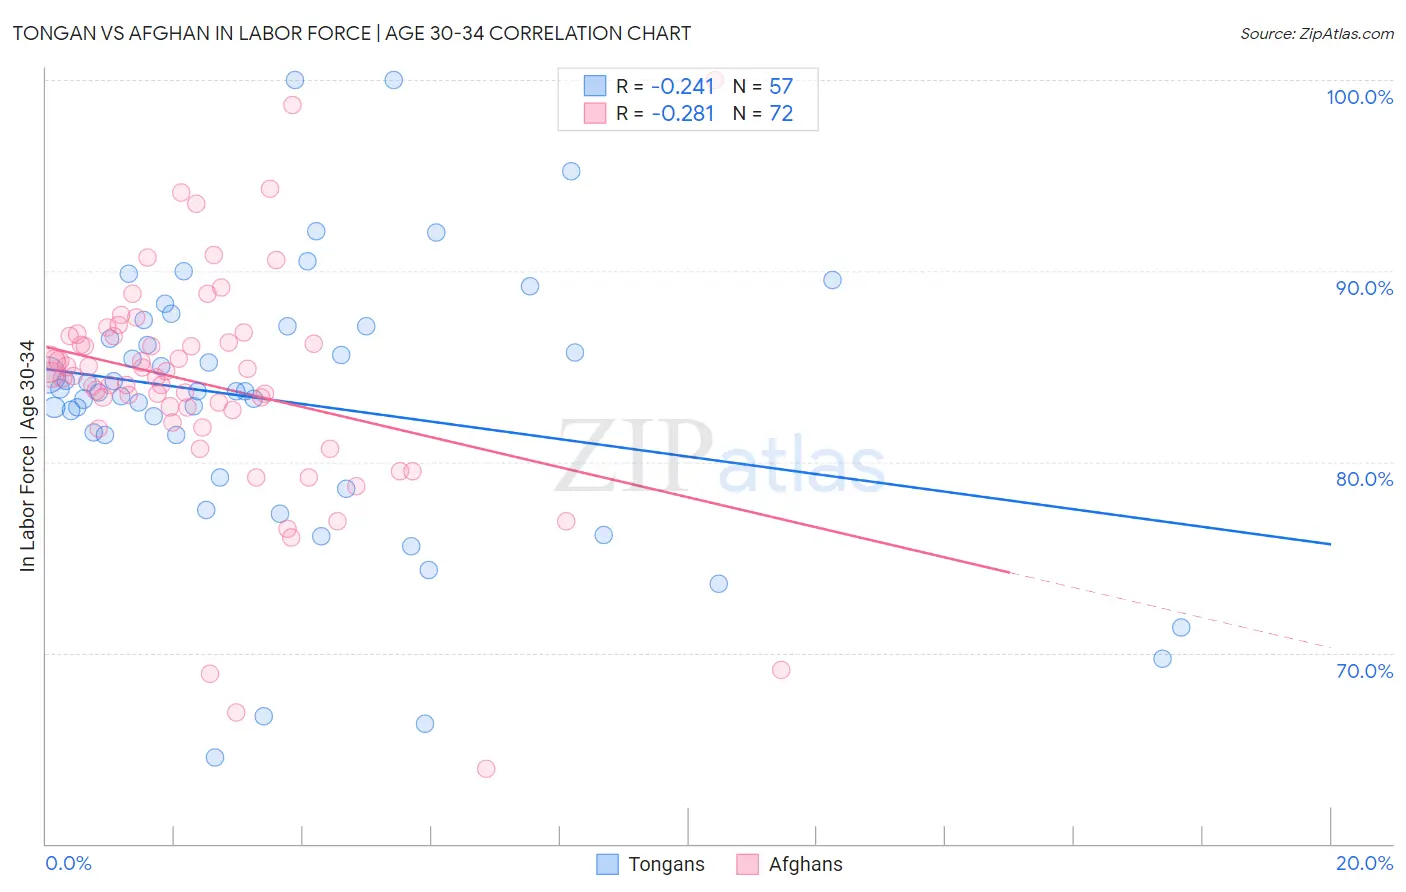
Tongan vs Afghan In Labor Force | Age 30-34 Correlation Chart
The statistical analysis conducted on geographies consisting of 102,882,684 people shows a weak negative correlation between the proportion of Tongans and labor force participation rate among population between the ages 30 and 34 in the United States with a correlation coefficient (R) of -0.241 and weighted average of 83.5%. Similarly, the statistical analysis conducted on geographies consisting of 148,857,099 people shows a weak negative correlation between the proportion of Afghans and labor force participation rate among population between the ages 30 and 34 in the United States with a correlation coefficient (R) of -0.281 and weighted average of 84.7%, a difference of 1.5%.
In Labor Force | Age 30-34 Correlation Summary
| Measurement | Tongan | Afghan |
| Minimum | 64.5% | 63.9% |
| Maximum | 100.0% | 100.0% |
| Range | 35.5% | 36.1% |
| Mean | 83.2% | 84.1% |
| Median | 83.7% | 84.5% |
| Interquartile 25% (IQ1) | 80.3% | 82.4% |
| Interquartile 75% (IQ3) | 87.1% | 86.6% |
| Interquartile Range (IQR) | 6.8% | 4.2% |
| Standard Deviation (Sample) | 7.2% | 6.1% |
| Standard Deviation (Population) | 7.1% | 6.0% |
Similar Demographics by In Labor Force | Age 30-34
Demographics Similar to Tongans by In Labor Force | Age 30-34
In terms of in labor force | age 30-34, the demographic groups most similar to Tongans are Immigrants from Grenada (83.5%, a difference of 0.010%), Guamanian/Chamorro (83.5%, a difference of 0.020%), Belizean (83.5%, a difference of 0.020%), Delaware (83.5%, a difference of 0.020%), and Fijian (83.4%, a difference of 0.070%).
| Demographics | Rating | Rank | In Labor Force | Age 30-34 |
| Vietnamese | 0.1 /100 | #269 | Tragic 83.6% |
| Spanish Americans | 0.0 /100 | #270 | Tragic 83.5% |
| Spanish | 0.0 /100 | #271 | Tragic 83.5% |
| Immigrants | Nonimmigrants | 0.0 /100 | #272 | Tragic 83.5% |
| Guamanians/Chamorros | 0.0 /100 | #273 | Tragic 83.5% |
| Belizeans | 0.0 /100 | #274 | Tragic 83.5% |
| Immigrants | Grenada | 0.0 /100 | #275 | Tragic 83.5% |
| Tongans | 0.0 /100 | #276 | Tragic 83.5% |
| Delaware | 0.0 /100 | #277 | Tragic 83.5% |
| Fijians | 0.0 /100 | #278 | Tragic 83.4% |
| Immigrants | Fiji | 0.0 /100 | #279 | Tragic 83.4% |
| Africans | 0.0 /100 | #280 | Tragic 83.4% |
| Samoans | 0.0 /100 | #281 | Tragic 83.3% |
| Mexican American Indians | 0.0 /100 | #282 | Tragic 83.2% |
| Assyrians/Chaldeans/Syriacs | 0.0 /100 | #283 | Tragic 83.2% |
Demographics Similar to Afghans by In Labor Force | Age 30-34
In terms of in labor force | age 30-34, the demographic groups most similar to Afghans are Icelander (84.7%, a difference of 0.010%), Immigrants from Western Europe (84.7%, a difference of 0.010%), Immigrants from South Eastern Asia (84.7%, a difference of 0.010%), South American (84.7%, a difference of 0.020%), and Immigrants from Uruguay (84.7%, a difference of 0.020%).
| Demographics | Rating | Rank | In Labor Force | Age 30-34 |
| Czechoslovakians | 63.0 /100 | #159 | Good 84.8% |
| Pakistanis | 60.8 /100 | #160 | Good 84.7% |
| Immigrants | Cambodia | 60.7 /100 | #161 | Good 84.7% |
| South Americans | 58.7 /100 | #162 | Average 84.7% |
| Immigrants | Uruguay | 57.4 /100 | #163 | Average 84.7% |
| Icelanders | 56.8 /100 | #164 | Average 84.7% |
| Immigrants | Western Europe | 56.7 /100 | #165 | Average 84.7% |
| Afghans | 55.2 /100 | #166 | Average 84.7% |
| Immigrants | South Eastern Asia | 54.2 /100 | #167 | Average 84.7% |
| Immigrants | Peru | 52.4 /100 | #168 | Average 84.7% |
| South American Indians | 52.1 /100 | #169 | Average 84.7% |
| Immigrants | Burma/Myanmar | 52.0 /100 | #170 | Average 84.7% |
| Irish | 52.0 /100 | #171 | Average 84.7% |
| Immigrants | England | 51.7 /100 | #172 | Average 84.7% |
| Israelis | 51.1 /100 | #173 | Average 84.7% |