Immigrants from Barbados vs Immigrants from Liberia In Labor Force | Age 25-29
COMPARE
Immigrants from Barbados
Immigrants from Liberia
In Labor Force | Age 25-29
In Labor Force | Age 25-29 Comparison
Immigrants from Barbados
Immigrants from Liberia
83.4%
IN LABOR FORCE | AGE 25-29
0.0/ 100
METRIC RATING
269th/ 347
METRIC RANK
85.9%
IN LABOR FORCE | AGE 25-29
100.0/ 100
METRIC RATING
29th/ 347
METRIC RANK
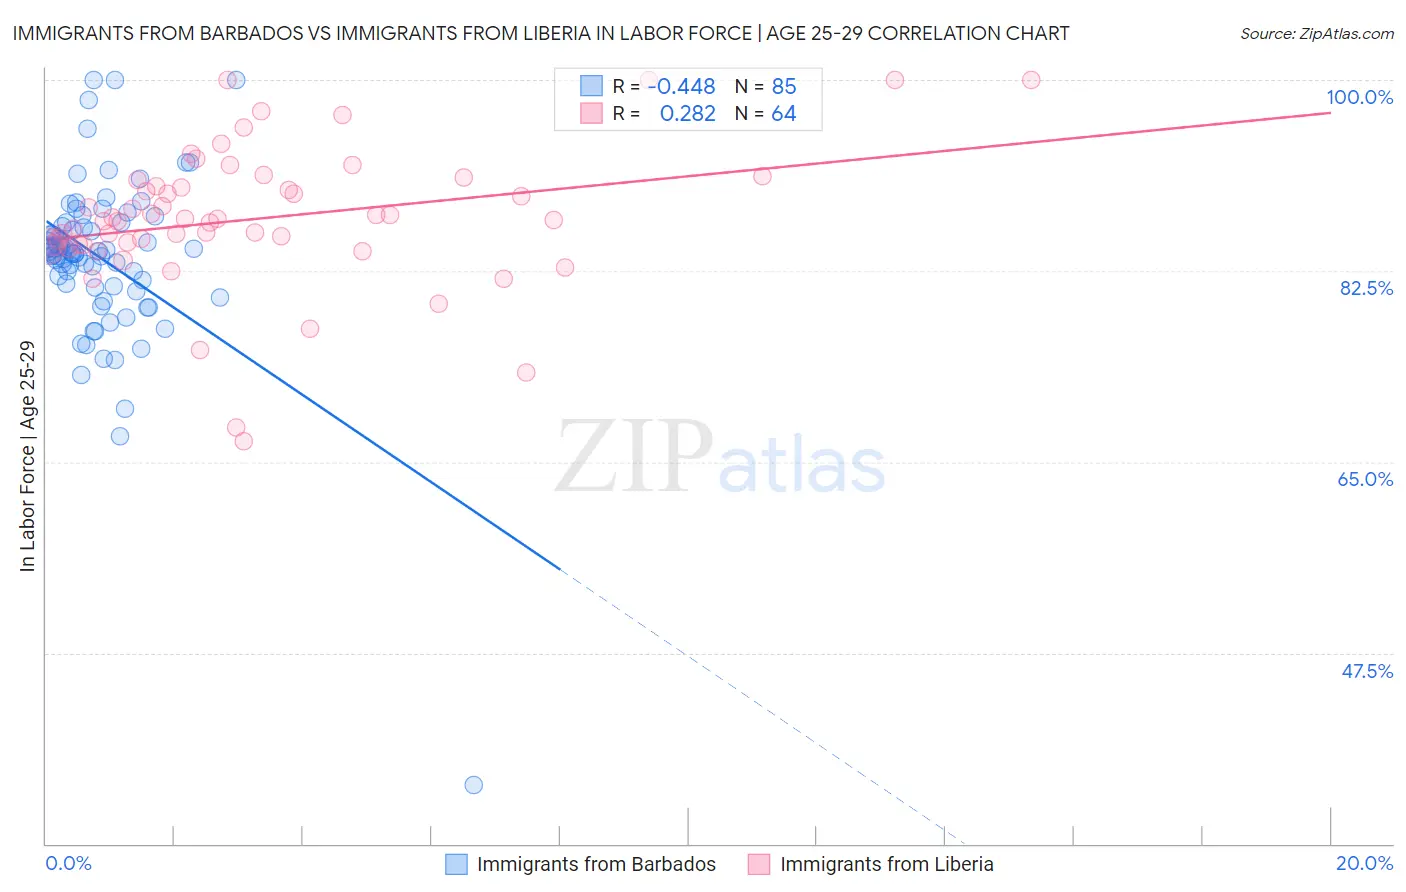
Immigrants from Barbados vs Immigrants from Liberia In Labor Force | Age 25-29 Correlation Chart
The statistical analysis conducted on geographies consisting of 112,776,614 people shows a moderate negative correlation between the proportion of Immigrants from Barbados and labor force participation rate among population between the ages 25 and 29 in the United States with a correlation coefficient (R) of -0.448 and weighted average of 83.4%. Similarly, the statistical analysis conducted on geographies consisting of 135,263,214 people shows a weak positive correlation between the proportion of Immigrants from Liberia and labor force participation rate among population between the ages 25 and 29 in the United States with a correlation coefficient (R) of 0.282 and weighted average of 85.9%, a difference of 3.0%.
In Labor Force | Age 25-29 Correlation Summary
| Measurement | Immigrants from Barbados | Immigrants from Liberia |
| Minimum | 35.4% | 66.9% |
| Maximum | 100.0% | 100.0% |
| Range | 64.6% | 33.1% |
| Mean | 83.6% | 87.3% |
| Median | 84.2% | 87.2% |
| Interquartile 25% (IQ1) | 81.1% | 84.9% |
| Interquartile 75% (IQ3) | 86.8% | 90.5% |
| Interquartile Range (IQR) | 5.7% | 5.6% |
| Standard Deviation (Sample) | 8.0% | 6.5% |
| Standard Deviation (Population) | 7.9% | 6.4% |
Similar Demographics by In Labor Force | Age 25-29
Demographics Similar to Immigrants from Barbados by In Labor Force | Age 25-29
In terms of in labor force | age 25-29, the demographic groups most similar to Immigrants from Barbados are Immigrants from Lebanon (83.4%, a difference of 0.0%), Spanish American (83.4%, a difference of 0.010%), Basque (83.4%, a difference of 0.010%), Aleut (83.4%, a difference of 0.020%), and Honduran (83.4%, a difference of 0.040%).
| Demographics | Rating | Rank | In Labor Force | Age 25-29 |
| Immigrants | Fiji | 0.1 /100 | #262 | Tragic 83.6% |
| West Indians | 0.1 /100 | #263 | Tragic 83.5% |
| Puget Sound Salish | 0.1 /100 | #264 | Tragic 83.5% |
| Cubans | 0.1 /100 | #265 | Tragic 83.5% |
| Aleuts | 0.0 /100 | #266 | Tragic 83.4% |
| Spanish Americans | 0.0 /100 | #267 | Tragic 83.4% |
| Immigrants | Lebanon | 0.0 /100 | #268 | Tragic 83.4% |
| Immigrants | Barbados | 0.0 /100 | #269 | Tragic 83.4% |
| Basques | 0.0 /100 | #270 | Tragic 83.4% |
| Hondurans | 0.0 /100 | #271 | Tragic 83.4% |
| Immigrants | Caribbean | 0.0 /100 | #272 | Tragic 83.4% |
| Immigrants | Dominica | 0.0 /100 | #273 | Tragic 83.4% |
| Marshallese | 0.0 /100 | #274 | Tragic 83.3% |
| Samoans | 0.0 /100 | #275 | Tragic 83.3% |
| Immigrants | Honduras | 0.0 /100 | #276 | Tragic 83.3% |
Demographics Similar to Immigrants from Liberia by In Labor Force | Age 25-29
In terms of in labor force | age 25-29, the demographic groups most similar to Immigrants from Liberia are Ugandan (85.9%, a difference of 0.0%), Paraguayan (85.9%, a difference of 0.010%), Immigrants from North Macedonia (85.9%, a difference of 0.020%), Immigrants from Serbia (85.9%, a difference of 0.040%), and German Russian (85.8%, a difference of 0.050%).
| Demographics | Rating | Rank | In Labor Force | Age 25-29 |
| Cambodians | 100.0 /100 | #22 | Exceptional 86.0% |
| Immigrants | Uganda | 100.0 /100 | #23 | Exceptional 86.0% |
| Immigrants | Eastern Africa | 100.0 /100 | #24 | Exceptional 86.0% |
| Sudanese | 100.0 /100 | #25 | Exceptional 85.9% |
| Immigrants | North Macedonia | 100.0 /100 | #26 | Exceptional 85.9% |
| Paraguayans | 100.0 /100 | #27 | Exceptional 85.9% |
| Ugandans | 100.0 /100 | #28 | Exceptional 85.9% |
| Immigrants | Liberia | 100.0 /100 | #29 | Exceptional 85.9% |
| Immigrants | Serbia | 100.0 /100 | #30 | Exceptional 85.9% |
| German Russians | 100.0 /100 | #31 | Exceptional 85.8% |
| Slovaks | 100.0 /100 | #32 | Exceptional 85.8% |
| Immigrants | Bulgaria | 100.0 /100 | #33 | Exceptional 85.8% |
| Lithuanians | 99.9 /100 | #34 | Exceptional 85.8% |
| Cypriots | 99.9 /100 | #35 | Exceptional 85.8% |
| Immigrants | Nepal | 99.9 /100 | #36 | Exceptional 85.8% |