Immigrants from Uzbekistan vs Thai In Labor Force | Age 25-29
COMPARE
Immigrants from Uzbekistan
Thai
In Labor Force | Age 25-29
In Labor Force | Age 25-29 Comparison
Immigrants from Uzbekistan
Thais
83.9%
IN LABOR FORCE | AGE 25-29
0.8/ 100
METRIC RATING
238th/ 347
METRIC RANK
85.5%
IN LABOR FORCE | AGE 25-29
99.5/ 100
METRIC RATING
60th/ 347
METRIC RANK
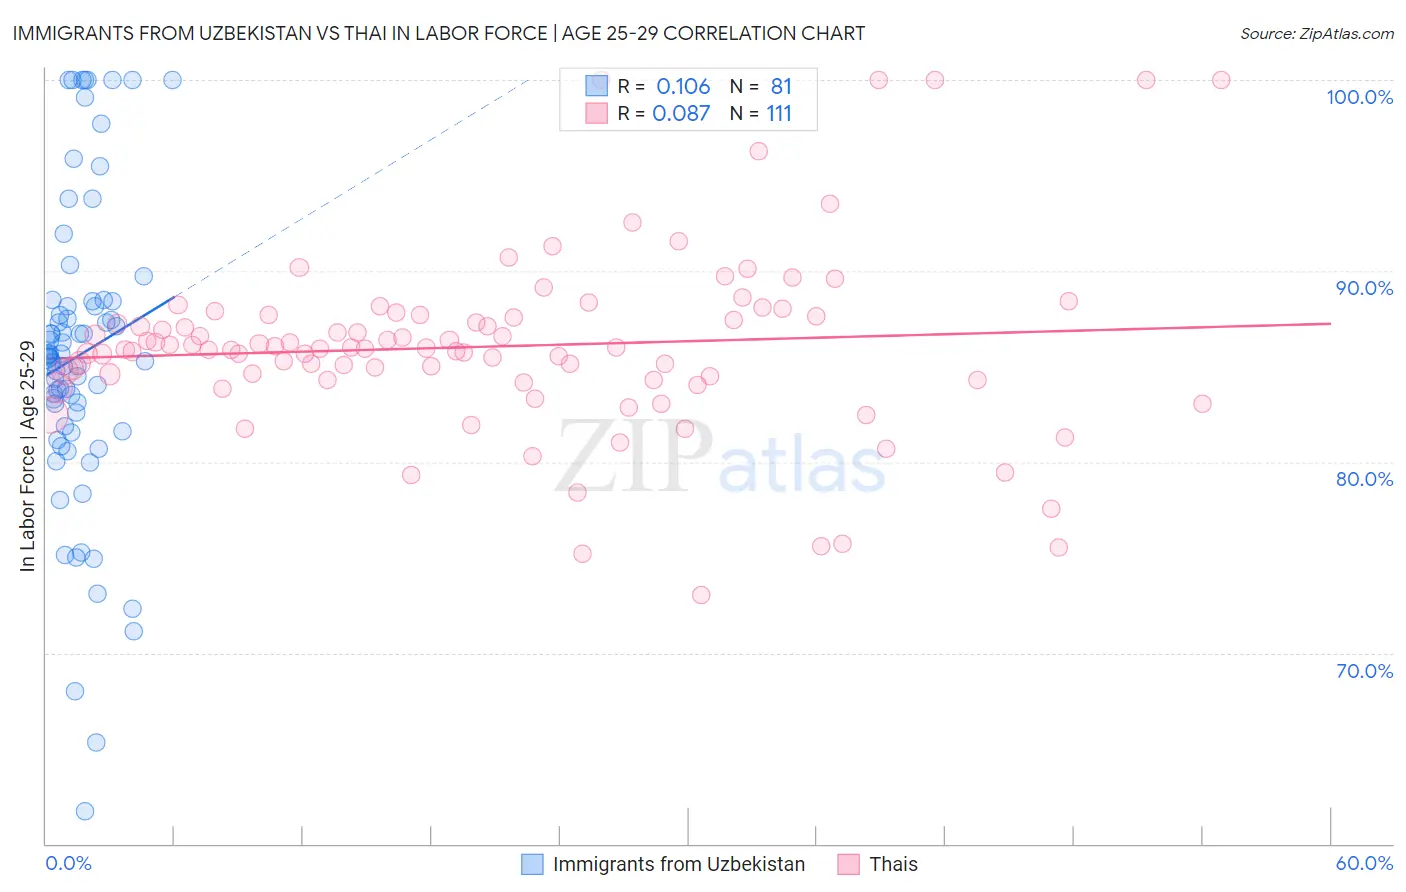
Immigrants from Uzbekistan vs Thai In Labor Force | Age 25-29 Correlation Chart
The statistical analysis conducted on geographies consisting of 118,738,553 people shows a poor positive correlation between the proportion of Immigrants from Uzbekistan and labor force participation rate among population between the ages 25 and 29 in the United States with a correlation coefficient (R) of 0.106 and weighted average of 83.9%. Similarly, the statistical analysis conducted on geographies consisting of 475,509,685 people shows a slight positive correlation between the proportion of Thais and labor force participation rate among population between the ages 25 and 29 in the United States with a correlation coefficient (R) of 0.087 and weighted average of 85.5%, a difference of 1.9%.
In Labor Force | Age 25-29 Correlation Summary
| Measurement | Immigrants from Uzbekistan | Thai |
| Minimum | 61.7% | 73.0% |
| Maximum | 100.0% | 100.0% |
| Range | 38.3% | 27.0% |
| Mean | 85.6% | 86.0% |
| Median | 85.5% | 85.9% |
| Interquartile 25% (IQ1) | 81.7% | 84.3% |
| Interquartile 75% (IQ3) | 88.4% | 87.7% |
| Interquartile Range (IQR) | 6.7% | 3.4% |
| Standard Deviation (Sample) | 8.0% | 4.8% |
| Standard Deviation (Population) | 8.0% | 4.8% |
Similar Demographics by In Labor Force | Age 25-29
Demographics Similar to Immigrants from Uzbekistan by In Labor Force | Age 25-29
In terms of in labor force | age 25-29, the demographic groups most similar to Immigrants from Uzbekistan are Jamaican (83.9%, a difference of 0.0%), Trinidadian and Tobagonian (83.9%, a difference of 0.010%), Iraqi (83.9%, a difference of 0.030%), Guamanian/Chamorro (83.9%, a difference of 0.030%), and Immigrants (83.9%, a difference of 0.030%).
| Demographics | Rating | Rank | In Labor Force | Age 25-29 |
| Immigrants | Philippines | 4.7 /100 | #231 | Tragic 84.2% |
| Panamanians | 4.5 /100 | #232 | Tragic 84.2% |
| Immigrants | Western Asia | 2.7 /100 | #233 | Tragic 84.1% |
| Barbadians | 1.0 /100 | #234 | Tragic 83.9% |
| Iraqis | 0.9 /100 | #235 | Tragic 83.9% |
| Guamanians/Chamorros | 0.9 /100 | #236 | Tragic 83.9% |
| Immigrants | Immigrants | 0.9 /100 | #237 | Tragic 83.9% |
| Immigrants | Uzbekistan | 0.8 /100 | #238 | Tragic 83.9% |
| Jamaicans | 0.8 /100 | #239 | Tragic 83.9% |
| Trinidadians and Tobagonians | 0.7 /100 | #240 | Tragic 83.9% |
| Alsatians | 0.7 /100 | #241 | Tragic 83.9% |
| U.S. Virgin Islanders | 0.6 /100 | #242 | Tragic 83.8% |
| Salvadorans | 0.5 /100 | #243 | Tragic 83.8% |
| Immigrants | Jamaica | 0.4 /100 | #244 | Tragic 83.8% |
| Iroquois | 0.4 /100 | #245 | Tragic 83.8% |
Demographics Similar to Thais by In Labor Force | Age 25-29
In terms of in labor force | age 25-29, the demographic groups most similar to Thais are Serbian (85.5%, a difference of 0.0%), Taiwanese (85.4%, a difference of 0.020%), Immigrants from Kenya (85.4%, a difference of 0.020%), Immigrants from Morocco (85.5%, a difference of 0.030%), and Estonian (85.5%, a difference of 0.040%).
| Demographics | Rating | Rank | In Labor Force | Age 25-29 |
| Belgians | 99.7 /100 | #53 | Exceptional 85.5% |
| Albanians | 99.7 /100 | #54 | Exceptional 85.5% |
| Immigrants | Brazil | 99.7 /100 | #55 | Exceptional 85.5% |
| Eastern Europeans | 99.6 /100 | #56 | Exceptional 85.5% |
| Estonians | 99.6 /100 | #57 | Exceptional 85.5% |
| Greeks | 99.6 /100 | #58 | Exceptional 85.5% |
| Immigrants | Morocco | 99.5 /100 | #59 | Exceptional 85.5% |
| Thais | 99.5 /100 | #60 | Exceptional 85.5% |
| Serbians | 99.5 /100 | #61 | Exceptional 85.5% |
| Taiwanese | 99.4 /100 | #62 | Exceptional 85.4% |
| Immigrants | Kenya | 99.4 /100 | #63 | Exceptional 85.4% |
| Immigrants | Italy | 99.3 /100 | #64 | Exceptional 85.4% |
| Immigrants | Czechoslovakia | 99.3 /100 | #65 | Exceptional 85.4% |
| Immigrants | Scotland | 99.3 /100 | #66 | Exceptional 85.4% |
| Immigrants | Turkey | 99.2 /100 | #67 | Exceptional 85.4% |