Estonian vs Korean In Labor Force | Age 45-54
COMPARE
Estonian
Korean
In Labor Force | Age 45-54
In Labor Force | Age 45-54 Comparison
Estonians
Koreans
83.4%
IN LABOR FORCE | AGE 45-54
96.9/ 100
METRIC RATING
75th/ 347
METRIC RANK
82.9%
IN LABOR FORCE | AGE 45-54
71.9/ 100
METRIC RATING
151st/ 347
METRIC RANK
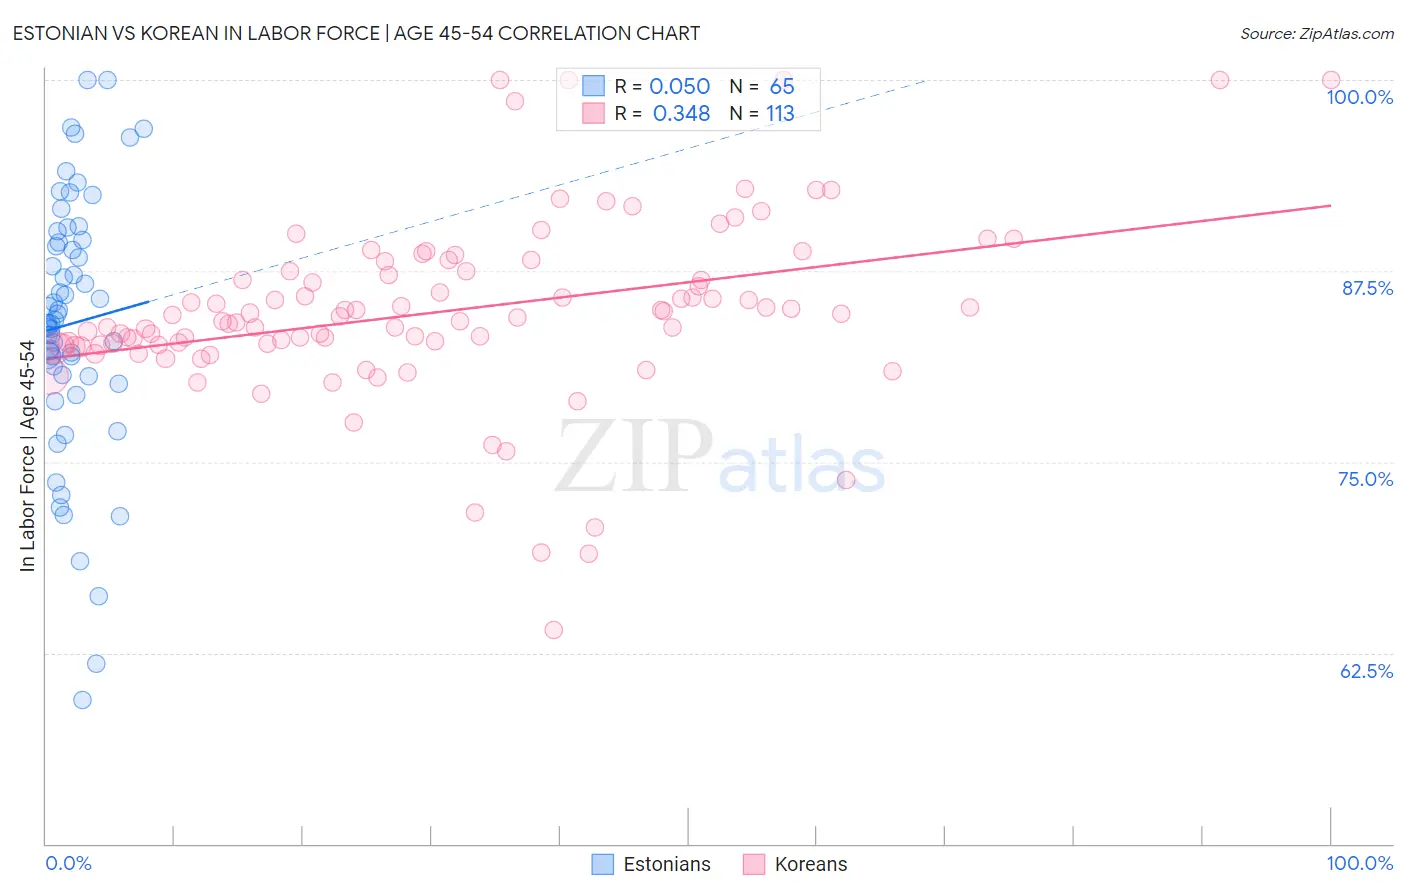
Estonian vs Korean In Labor Force | Age 45-54 Correlation Chart
The statistical analysis conducted on geographies consisting of 123,497,909 people shows no correlation between the proportion of Estonians and labor force participation rate among population between the ages 45 and 54 in the United States with a correlation coefficient (R) of 0.050 and weighted average of 83.4%. Similarly, the statistical analysis conducted on geographies consisting of 510,364,198 people shows a mild positive correlation between the proportion of Koreans and labor force participation rate among population between the ages 45 and 54 in the United States with a correlation coefficient (R) of 0.348 and weighted average of 82.9%, a difference of 0.55%.
In Labor Force | Age 45-54 Correlation Summary
| Measurement | Estonian | Korean |
| Minimum | 59.4% | 64.0% |
| Maximum | 100.0% | 100.0% |
| Range | 40.6% | 36.0% |
| Mean | 84.0% | 84.8% |
| Median | 84.0% | 84.5% |
| Interquartile 25% (IQ1) | 80.7% | 82.6% |
| Interquartile 75% (IQ3) | 89.4% | 87.5% |
| Interquartile Range (IQR) | 8.8% | 4.9% |
| Standard Deviation (Sample) | 8.4% | 6.0% |
| Standard Deviation (Population) | 8.4% | 6.0% |
Similar Demographics by In Labor Force | Age 45-54
Demographics Similar to Estonians by In Labor Force | Age 45-54
In terms of in labor force | age 45-54, the demographic groups most similar to Estonians are Immigrants from Somalia (83.4%, a difference of 0.0%), Russian (83.4%, a difference of 0.0%), Immigrants from Czechoslovakia (83.4%, a difference of 0.010%), Cuban (83.4%, a difference of 0.010%), and Serbian (83.4%, a difference of 0.020%).
| Demographics | Rating | Rank | In Labor Force | Age 45-54 |
| Immigrants | Colombia | 97.6 /100 | #68 | Exceptional 83.4% |
| Taiwanese | 97.5 /100 | #69 | Exceptional 83.4% |
| Immigrants | Latvia | 97.4 /100 | #70 | Exceptional 83.4% |
| Colombians | 97.3 /100 | #71 | Exceptional 83.4% |
| Serbians | 97.2 /100 | #72 | Exceptional 83.4% |
| Immigrants | Czechoslovakia | 97.1 /100 | #73 | Exceptional 83.4% |
| Immigrants | Somalia | 96.9 /100 | #74 | Exceptional 83.4% |
| Estonians | 96.9 /100 | #75 | Exceptional 83.4% |
| Russians | 96.8 /100 | #76 | Exceptional 83.4% |
| Cubans | 96.7 /100 | #77 | Exceptional 83.4% |
| Immigrants | Egypt | 96.6 /100 | #78 | Exceptional 83.4% |
| Belgians | 96.5 /100 | #79 | Exceptional 83.4% |
| Immigrants | Croatia | 96.5 /100 | #80 | Exceptional 83.4% |
| Jordanians | 96.4 /100 | #81 | Exceptional 83.4% |
| Immigrants | Eastern Asia | 96.3 /100 | #82 | Exceptional 83.4% |
Demographics Similar to Koreans by In Labor Force | Age 45-54
In terms of in labor force | age 45-54, the demographic groups most similar to Koreans are Immigrants from Sweden (82.9%, a difference of 0.010%), Immigrants from Netherlands (82.9%, a difference of 0.010%), Slavic (82.9%, a difference of 0.010%), Immigrants from Indonesia (82.9%, a difference of 0.010%), and Immigrants from Nigeria (83.0%, a difference of 0.020%).
| Demographics | Rating | Rank | In Labor Force | Age 45-54 |
| Soviet Union | 76.8 /100 | #144 | Good 83.0% |
| Romanians | 75.4 /100 | #145 | Good 83.0% |
| Immigrants | France | 75.3 /100 | #146 | Good 83.0% |
| Czechoslovakians | 74.8 /100 | #147 | Good 83.0% |
| Immigrants | Nigeria | 74.1 /100 | #148 | Good 83.0% |
| Immigrants | Sweden | 73.3 /100 | #149 | Good 82.9% |
| Immigrants | Netherlands | 72.6 /100 | #150 | Good 82.9% |
| Koreans | 71.9 /100 | #151 | Good 82.9% |
| Slavs | 71.5 /100 | #152 | Good 82.9% |
| Immigrants | Indonesia | 70.6 /100 | #153 | Good 82.9% |
| Immigrants | Ghana | 70.3 /100 | #154 | Good 82.9% |
| Immigrants | Philippines | 69.0 /100 | #155 | Good 82.9% |
| Immigrants | Saudi Arabia | 68.8 /100 | #156 | Good 82.9% |
| Immigrants | Australia | 68.2 /100 | #157 | Good 82.9% |
| Immigrants | Southern Europe | 67.8 /100 | #158 | Good 82.9% |