Portuguese vs Belizean In Labor Force | Age 45-54
COMPARE
Portuguese
Belizean
In Labor Force | Age 45-54
In Labor Force | Age 45-54 Comparison
Portuguese
Belizeans
82.2%
IN LABOR FORCE | AGE 45-54
4.7/ 100
METRIC RATING
217th/ 347
METRIC RANK
80.8%
IN LABOR FORCE | AGE 45-54
0.0/ 100
METRIC RATING
284th/ 347
METRIC RANK
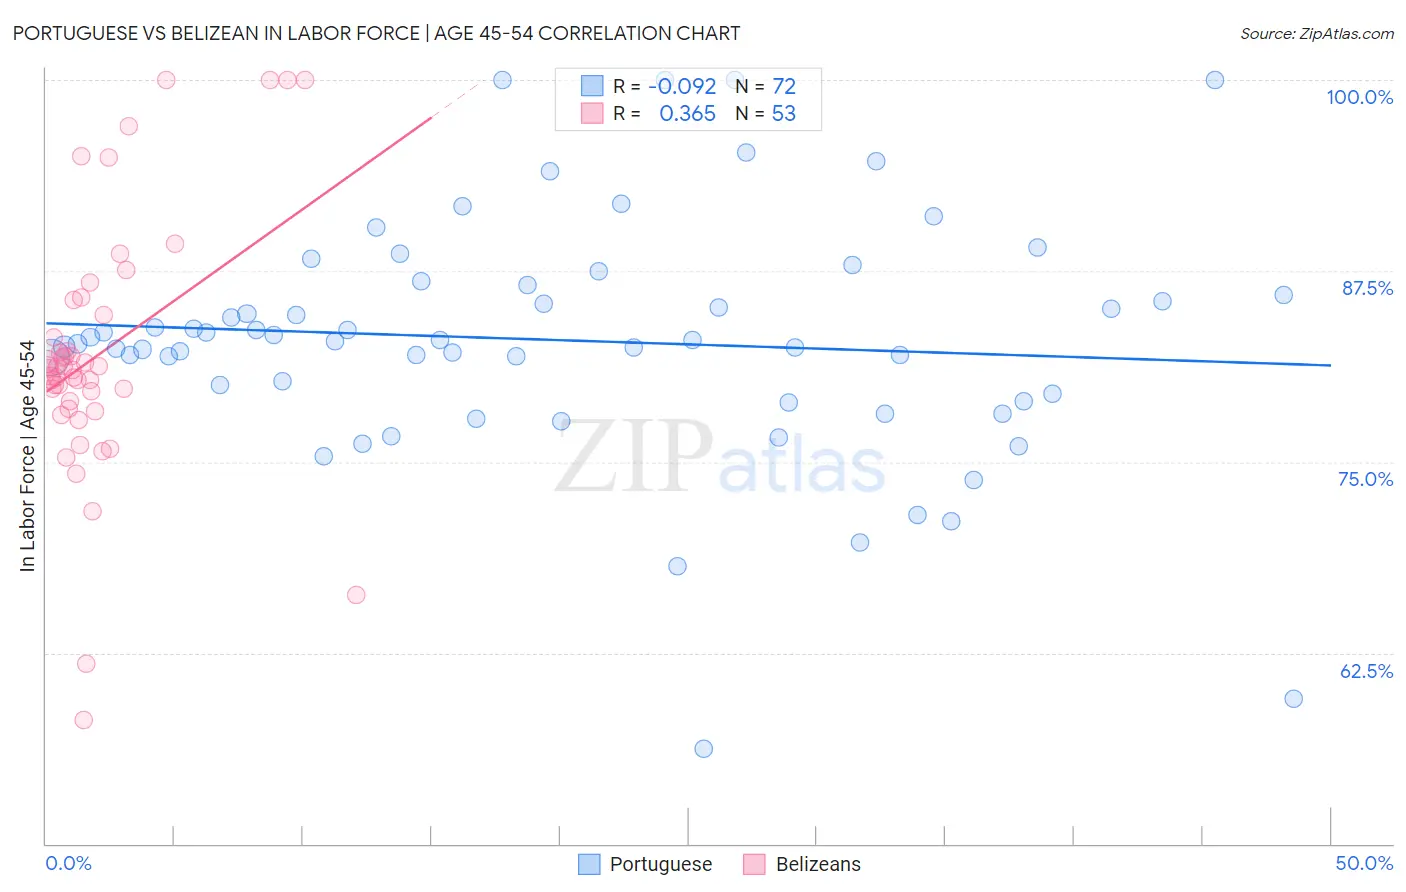
Portuguese vs Belizean In Labor Force | Age 45-54 Correlation Chart
The statistical analysis conducted on geographies consisting of 449,955,919 people shows a slight negative correlation between the proportion of Portuguese and labor force participation rate among population between the ages 45 and 54 in the United States with a correlation coefficient (R) of -0.092 and weighted average of 82.2%. Similarly, the statistical analysis conducted on geographies consisting of 144,162,526 people shows a mild positive correlation between the proportion of Belizeans and labor force participation rate among population between the ages 45 and 54 in the United States with a correlation coefficient (R) of 0.365 and weighted average of 80.8%, a difference of 1.8%.
In Labor Force | Age 45-54 Correlation Summary
| Measurement | Portuguese | Belizean |
| Minimum | 56.2% | 58.1% |
| Maximum | 100.0% | 100.0% |
| Range | 43.8% | 41.9% |
| Mean | 83.0% | 82.0% |
| Median | 82.9% | 81.1% |
| Interquartile 25% (IQ1) | 79.2% | 78.7% |
| Interquartile 75% (IQ3) | 86.2% | 85.1% |
| Interquartile Range (IQR) | 7.0% | 6.4% |
| Standard Deviation (Sample) | 7.9% | 8.4% |
| Standard Deviation (Population) | 7.9% | 8.4% |
Similar Demographics by In Labor Force | Age 45-54
Demographics Similar to Portuguese by In Labor Force | Age 45-54
In terms of in labor force | age 45-54, the demographic groups most similar to Portuguese are English (82.2%, a difference of 0.020%), Scottish (82.2%, a difference of 0.030%), French (82.2%, a difference of 0.030%), Immigrants from Panama (82.2%, a difference of 0.040%), and Iraqi (82.2%, a difference of 0.040%).
| Demographics | Rating | Rank | In Labor Force | Age 45-54 |
| Immigrants | Bahamas | 7.1 /100 | #210 | Tragic 82.3% |
| Immigrants | Syria | 6.6 /100 | #211 | Tragic 82.3% |
| Ecuadorians | 6.3 /100 | #212 | Tragic 82.3% |
| Immigrants | Uzbekistan | 5.8 /100 | #213 | Tragic 82.3% |
| Immigrants | Panama | 5.6 /100 | #214 | Tragic 82.2% |
| Iraqis | 5.6 /100 | #215 | Tragic 82.2% |
| Scottish | 5.3 /100 | #216 | Tragic 82.2% |
| Portuguese | 4.7 /100 | #217 | Tragic 82.2% |
| English | 4.4 /100 | #218 | Tragic 82.2% |
| French | 4.1 /100 | #219 | Tragic 82.2% |
| Bahamians | 3.6 /100 | #220 | Tragic 82.2% |
| Panamanians | 3.5 /100 | #221 | Tragic 82.2% |
| Immigrants | Ecuador | 3.4 /100 | #222 | Tragic 82.2% |
| Immigrants | Immigrants | 3.1 /100 | #223 | Tragic 82.1% |
| Immigrants | Jamaica | 2.7 /100 | #224 | Tragic 82.1% |
Demographics Similar to Belizeans by In Labor Force | Age 45-54
In terms of in labor force | age 45-54, the demographic groups most similar to Belizeans are Delaware (80.8%, a difference of 0.010%), Immigrants from Dominica (80.8%, a difference of 0.010%), Vietnamese (80.8%, a difference of 0.020%), Cree (80.8%, a difference of 0.020%), and French American Indian (80.8%, a difference of 0.050%).
| Demographics | Rating | Rank | In Labor Force | Age 45-54 |
| Guatemalans | 0.0 /100 | #277 | Tragic 81.2% |
| Immigrants | Guatemala | 0.0 /100 | #278 | Tragic 81.1% |
| Immigrants | Micronesia | 0.0 /100 | #279 | Tragic 81.1% |
| Immigrants | Latin America | 0.0 /100 | #280 | Tragic 81.0% |
| Immigrants | Grenada | 0.0 /100 | #281 | Tragic 81.0% |
| Aleuts | 0.0 /100 | #282 | Tragic 81.0% |
| French American Indians | 0.0 /100 | #283 | Tragic 80.8% |
| Belizeans | 0.0 /100 | #284 | Tragic 80.8% |
| Delaware | 0.0 /100 | #285 | Tragic 80.8% |
| Immigrants | Dominica | 0.0 /100 | #286 | Tragic 80.8% |
| Vietnamese | 0.0 /100 | #287 | Tragic 80.8% |
| Cree | 0.0 /100 | #288 | Tragic 80.8% |
| Immigrants | Bangladesh | 0.0 /100 | #289 | Tragic 80.7% |
| Mexican American Indians | 0.0 /100 | #290 | Tragic 80.7% |
| Immigrants | Belize | 0.0 /100 | #291 | Tragic 80.6% |