Immigrants from Turkey vs Comanche In Labor Force | Age 45-54
COMPARE
Immigrants from Turkey
Comanche
In Labor Force | Age 45-54
In Labor Force | Age 45-54 Comparison
Immigrants from Turkey
Comanche
83.6%
IN LABOR FORCE | AGE 45-54
98.8/ 100
METRIC RATING
51st/ 347
METRIC RANK
79.2%
IN LABOR FORCE | AGE 45-54
0.0/ 100
METRIC RATING
317th/ 347
METRIC RANK
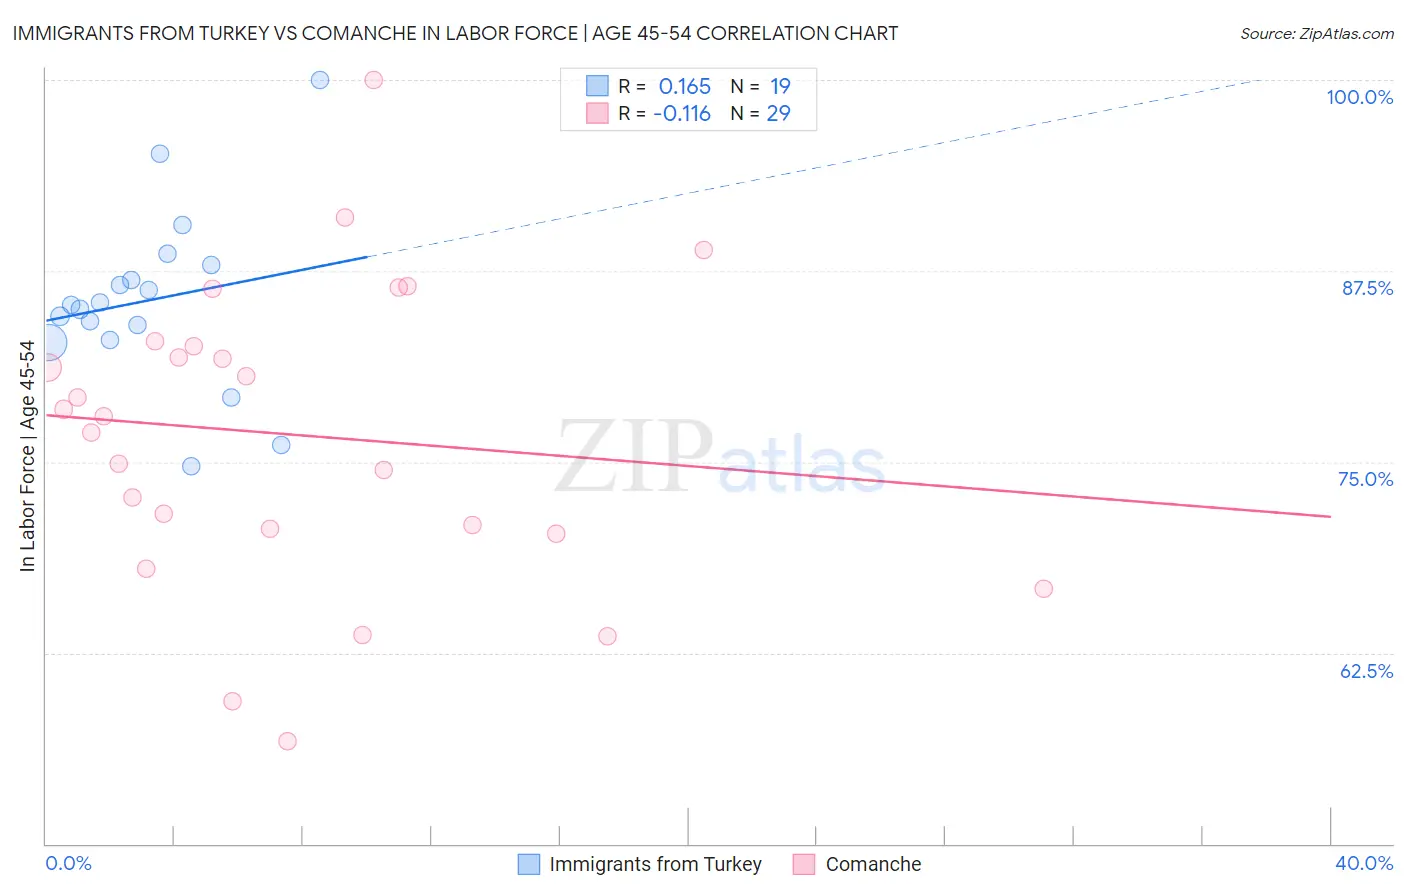
Immigrants from Turkey vs Comanche In Labor Force | Age 45-54 Correlation Chart
The statistical analysis conducted on geographies consisting of 222,959,363 people shows a poor positive correlation between the proportion of Immigrants from Turkey and labor force participation rate among population between the ages 45 and 54 in the United States with a correlation coefficient (R) of 0.165 and weighted average of 83.6%. Similarly, the statistical analysis conducted on geographies consisting of 109,767,543 people shows a poor negative correlation between the proportion of Comanche and labor force participation rate among population between the ages 45 and 54 in the United States with a correlation coefficient (R) of -0.116 and weighted average of 79.2%, a difference of 5.5%.
In Labor Force | Age 45-54 Correlation Summary
| Measurement | Immigrants from Turkey | Comanche |
| Minimum | 74.7% | 56.7% |
| Maximum | 100.0% | 100.0% |
| Range | 25.3% | 43.3% |
| Mean | 85.6% | 76.8% |
| Median | 85.3% | 78.0% |
| Interquartile 25% (IQ1) | 83.0% | 70.5% |
| Interquartile 75% (IQ3) | 87.9% | 82.7% |
| Interquartile Range (IQR) | 4.9% | 12.2% |
| Standard Deviation (Sample) | 5.8% | 9.9% |
| Standard Deviation (Population) | 5.7% | 9.7% |
Similar Demographics by In Labor Force | Age 45-54
Demographics Similar to Immigrants from Turkey by In Labor Force | Age 45-54
In terms of in labor force | age 45-54, the demographic groups most similar to Immigrants from Turkey are Polish (83.6%, a difference of 0.0%), Peruvian (83.6%, a difference of 0.0%), Immigrants from Greece (83.6%, a difference of 0.010%), Somali (83.5%, a difference of 0.010%), and Macedonian (83.5%, a difference of 0.020%).
| Demographics | Rating | Rank | In Labor Force | Age 45-54 |
| Burmese | 99.1 /100 | #44 | Exceptional 83.6% |
| Immigrants | Hong Kong | 99.1 /100 | #45 | Exceptional 83.6% |
| Lithuanians | 99.1 /100 | #46 | Exceptional 83.6% |
| Croatians | 99.0 /100 | #47 | Exceptional 83.6% |
| Immigrants | Poland | 99.0 /100 | #48 | Exceptional 83.6% |
| Immigrants | Morocco | 99.0 /100 | #49 | Exceptional 83.6% |
| Immigrants | Greece | 98.8 /100 | #50 | Exceptional 83.6% |
| Immigrants | Turkey | 98.8 /100 | #51 | Exceptional 83.6% |
| Poles | 98.7 /100 | #52 | Exceptional 83.6% |
| Peruvians | 98.7 /100 | #53 | Exceptional 83.6% |
| Somalis | 98.7 /100 | #54 | Exceptional 83.5% |
| Macedonians | 98.7 /100 | #55 | Exceptional 83.5% |
| Immigrants | Peru | 98.6 /100 | #56 | Exceptional 83.5% |
| Paraguayans | 98.5 /100 | #57 | Exceptional 83.5% |
| Eastern Europeans | 98.5 /100 | #58 | Exceptional 83.5% |
Demographics Similar to Comanche by In Labor Force | Age 45-54
In terms of in labor force | age 45-54, the demographic groups most similar to Comanche are Shoshone (79.3%, a difference of 0.13%), Chickasaw (79.0%, a difference of 0.17%), Black/African American (79.3%, a difference of 0.22%), Cherokee (79.0%, a difference of 0.28%), and Ottawa (79.5%, a difference of 0.35%).
| Demographics | Rating | Rank | In Labor Force | Age 45-54 |
| Inupiat | 0.0 /100 | #310 | Tragic 79.9% |
| Mexicans | 0.0 /100 | #311 | Tragic 79.8% |
| Immigrants | Mexico | 0.0 /100 | #312 | Tragic 79.7% |
| Colville | 0.0 /100 | #313 | Tragic 79.5% |
| Ottawa | 0.0 /100 | #314 | Tragic 79.5% |
| Blacks/African Americans | 0.0 /100 | #315 | Tragic 79.3% |
| Shoshone | 0.0 /100 | #316 | Tragic 79.3% |
| Comanche | 0.0 /100 | #317 | Tragic 79.2% |
| Chickasaw | 0.0 /100 | #318 | Tragic 79.0% |
| Cherokee | 0.0 /100 | #319 | Tragic 79.0% |
| Yaqui | 0.0 /100 | #320 | Tragic 78.9% |
| Yup'ik | 0.0 /100 | #321 | Tragic 78.6% |
| Crow | 0.0 /100 | #322 | Tragic 78.3% |
| Kiowa | 0.0 /100 | #323 | Tragic 78.3% |
| Dutch West Indians | 0.0 /100 | #324 | Tragic 78.2% |