Immigrants from Turkey vs Immigrants from Honduras In Labor Force | Age 45-54
COMPARE
Immigrants from Turkey
Immigrants from Honduras
In Labor Force | Age 45-54
In Labor Force | Age 45-54 Comparison
Immigrants from Turkey
Immigrants from Honduras
83.6%
IN LABOR FORCE | AGE 45-54
98.8/ 100
METRIC RATING
51st/ 347
METRIC RANK
81.4%
IN LABOR FORCE | AGE 45-54
0.0/ 100
METRIC RATING
268th/ 347
METRIC RANK
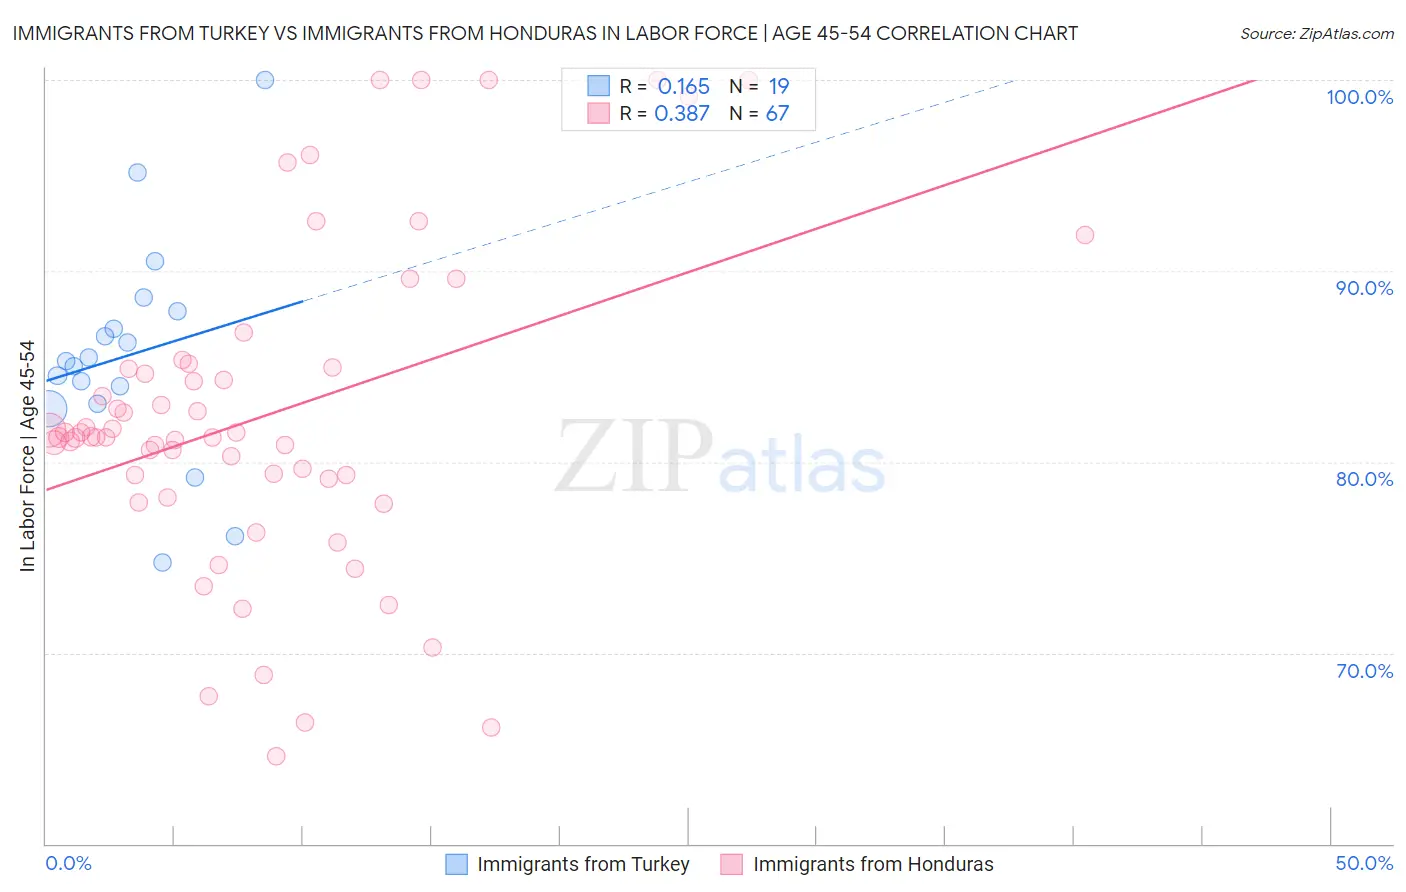
Immigrants from Turkey vs Immigrants from Honduras In Labor Force | Age 45-54 Correlation Chart
The statistical analysis conducted on geographies consisting of 222,959,363 people shows a poor positive correlation between the proportion of Immigrants from Turkey and labor force participation rate among population between the ages 45 and 54 in the United States with a correlation coefficient (R) of 0.165 and weighted average of 83.6%. Similarly, the statistical analysis conducted on geographies consisting of 322,456,034 people shows a mild positive correlation between the proportion of Immigrants from Honduras and labor force participation rate among population between the ages 45 and 54 in the United States with a correlation coefficient (R) of 0.387 and weighted average of 81.4%, a difference of 2.7%.
In Labor Force | Age 45-54 Correlation Summary
| Measurement | Immigrants from Turkey | Immigrants from Honduras |
| Minimum | 74.7% | 64.6% |
| Maximum | 100.0% | 100.0% |
| Range | 25.3% | 35.4% |
| Mean | 85.6% | 82.4% |
| Median | 85.3% | 81.3% |
| Interquartile 25% (IQ1) | 83.0% | 79.1% |
| Interquartile 75% (IQ3) | 87.9% | 84.9% |
| Interquartile Range (IQR) | 4.9% | 5.8% |
| Standard Deviation (Sample) | 5.8% | 8.4% |
| Standard Deviation (Population) | 5.7% | 8.3% |
Similar Demographics by In Labor Force | Age 45-54
Demographics Similar to Immigrants from Turkey by In Labor Force | Age 45-54
In terms of in labor force | age 45-54, the demographic groups most similar to Immigrants from Turkey are Polish (83.6%, a difference of 0.0%), Peruvian (83.6%, a difference of 0.0%), Immigrants from Greece (83.6%, a difference of 0.010%), Somali (83.5%, a difference of 0.010%), and Macedonian (83.5%, a difference of 0.020%).
| Demographics | Rating | Rank | In Labor Force | Age 45-54 |
| Burmese | 99.1 /100 | #44 | Exceptional 83.6% |
| Immigrants | Hong Kong | 99.1 /100 | #45 | Exceptional 83.6% |
| Lithuanians | 99.1 /100 | #46 | Exceptional 83.6% |
| Croatians | 99.0 /100 | #47 | Exceptional 83.6% |
| Immigrants | Poland | 99.0 /100 | #48 | Exceptional 83.6% |
| Immigrants | Morocco | 99.0 /100 | #49 | Exceptional 83.6% |
| Immigrants | Greece | 98.8 /100 | #50 | Exceptional 83.6% |
| Immigrants | Turkey | 98.8 /100 | #51 | Exceptional 83.6% |
| Poles | 98.7 /100 | #52 | Exceptional 83.6% |
| Peruvians | 98.7 /100 | #53 | Exceptional 83.6% |
| Somalis | 98.7 /100 | #54 | Exceptional 83.5% |
| Macedonians | 98.7 /100 | #55 | Exceptional 83.5% |
| Immigrants | Peru | 98.6 /100 | #56 | Exceptional 83.5% |
| Paraguayans | 98.5 /100 | #57 | Exceptional 83.5% |
| Eastern Europeans | 98.5 /100 | #58 | Exceptional 83.5% |
Demographics Similar to Immigrants from Honduras by In Labor Force | Age 45-54
In terms of in labor force | age 45-54, the demographic groups most similar to Immigrants from Honduras are West Indian (81.4%, a difference of 0.020%), Alsatian (81.3%, a difference of 0.020%), Immigrants from St. Vincent and the Grenadines (81.4%, a difference of 0.030%), Bangladeshi (81.3%, a difference of 0.050%), and Immigrants from Barbados (81.3%, a difference of 0.060%).
| Demographics | Rating | Rank | In Labor Force | Age 45-54 |
| Hawaiians | 0.1 /100 | #261 | Tragic 81.5% |
| Immigrants | Guyana | 0.1 /100 | #262 | Tragic 81.5% |
| Indonesians | 0.1 /100 | #263 | Tragic 81.5% |
| Immigrants | West Indies | 0.1 /100 | #264 | Tragic 81.5% |
| Hondurans | 0.1 /100 | #265 | Tragic 81.4% |
| Immigrants | St. Vincent and the Grenadines | 0.1 /100 | #266 | Tragic 81.4% |
| West Indians | 0.1 /100 | #267 | Tragic 81.4% |
| Immigrants | Honduras | 0.0 /100 | #268 | Tragic 81.4% |
| Alsatians | 0.0 /100 | #269 | Tragic 81.3% |
| Bangladeshis | 0.0 /100 | #270 | Tragic 81.3% |
| Immigrants | Barbados | 0.0 /100 | #271 | Tragic 81.3% |
| Spanish | 0.0 /100 | #272 | Tragic 81.3% |
| Chippewa | 0.0 /100 | #273 | Tragic 81.3% |
| British West Indians | 0.0 /100 | #274 | Tragic 81.2% |
| Immigrants | Nonimmigrants | 0.0 /100 | #275 | Tragic 81.2% |