Immigrants from Thailand vs European In Labor Force | Age 20-64
COMPARE
Immigrants from Thailand
European
In Labor Force | Age 20-64
In Labor Force | Age 20-64 Comparison
Immigrants from Thailand
Europeans
79.4%
IN LABOR FORCE | AGE 20-64
24.8/ 100
METRIC RATING
194th/ 347
METRIC RANK
79.3%
IN LABOR FORCE | AGE 20-64
15.3/ 100
METRIC RATING
211th/ 347
METRIC RANK
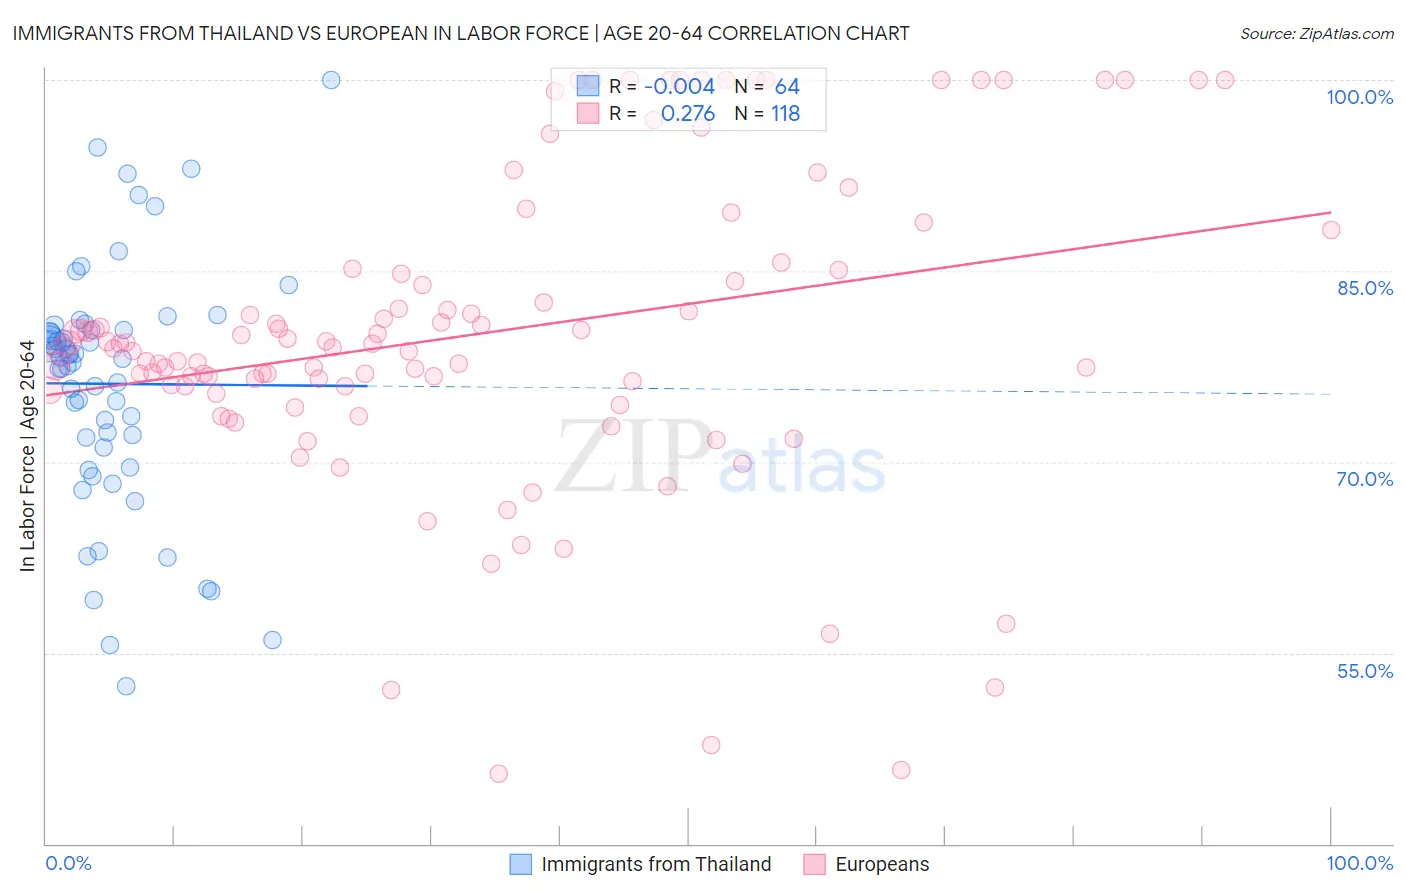
Immigrants from Thailand vs European In Labor Force | Age 20-64 Correlation Chart
The statistical analysis conducted on geographies consisting of 317,022,892 people shows no correlation between the proportion of Immigrants from Thailand and labor force participation rate among population between the ages 20 and 64 in the United States with a correlation coefficient (R) of -0.004 and weighted average of 79.4%. Similarly, the statistical analysis conducted on geographies consisting of 561,836,944 people shows a weak positive correlation between the proportion of Europeans and labor force participation rate among population between the ages 20 and 64 in the United States with a correlation coefficient (R) of 0.276 and weighted average of 79.3%, a difference of 0.12%.
In Labor Force | Age 20-64 Correlation Summary
| Measurement | Immigrants from Thailand | European |
| Minimum | 52.4% | 45.5% |
| Maximum | 100.0% | 100.0% |
| Range | 47.6% | 54.5% |
| Mean | 76.1% | 80.1% |
| Median | 78.2% | 79.1% |
| Interquartile 25% (IQ1) | 71.5% | 76.0% |
| Interquartile 75% (IQ3) | 80.4% | 85.1% |
| Interquartile Range (IQR) | 8.9% | 9.1% |
| Standard Deviation (Sample) | 9.5% | 12.1% |
| Standard Deviation (Population) | 9.5% | 12.1% |
Demographics Similar to Immigrants from Thailand and Europeans by In Labor Force | Age 20-64
In terms of in labor force | age 20-64, the demographic groups most similar to Immigrants from Thailand are Indonesian (79.4%, a difference of 0.010%), Immigrants from Austria (79.4%, a difference of 0.010%), Immigrants from Denmark (79.4%, a difference of 0.020%), Ecuadorian (79.4%, a difference of 0.020%), and Immigrants from Senegal (79.4%, a difference of 0.020%). Similarly, the demographic groups most similar to Europeans are Haitian (79.3%, a difference of 0.010%), Immigrants from Ecuador (79.3%, a difference of 0.020%), Subsaharan African (79.3%, a difference of 0.020%), British (79.3%, a difference of 0.020%), and Bangladeshi (79.3%, a difference of 0.020%).
| Demographics | Rating | Rank | In Labor Force | Age 20-64 |
| Immigrants | Denmark | 26.9 /100 | #192 | Fair 79.4% |
| Indonesians | 26.1 /100 | #193 | Fair 79.4% |
| Immigrants | Thailand | 24.8 /100 | #194 | Fair 79.4% |
| Immigrants | Austria | 23.7 /100 | #195 | Fair 79.4% |
| Ecuadorians | 23.1 /100 | #196 | Fair 79.4% |
| Immigrants | Senegal | 22.5 /100 | #197 | Fair 79.4% |
| Immigrants | Laos | 21.5 /100 | #198 | Fair 79.4% |
| Dutch | 20.2 /100 | #199 | Fair 79.3% |
| Immigrants | Oceania | 19.1 /100 | #200 | Poor 79.3% |
| Immigrants | Nicaragua | 19.0 /100 | #201 | Poor 79.3% |
| Nicaraguans | 18.3 /100 | #202 | Poor 79.3% |
| Iraqis | 17.7 /100 | #203 | Poor 79.3% |
| Immigrants | Cambodia | 17.6 /100 | #204 | Poor 79.3% |
| Immigrants | Congo | 17.5 /100 | #205 | Poor 79.3% |
| Immigrants | Ecuador | 16.9 /100 | #206 | Poor 79.3% |
| Sub-Saharan Africans | 16.5 /100 | #207 | Poor 79.3% |
| British | 16.5 /100 | #208 | Poor 79.3% |
| Bangladeshis | 16.4 /100 | #209 | Poor 79.3% |
| Haitians | 16.1 /100 | #210 | Poor 79.3% |
| Europeans | 15.3 /100 | #211 | Poor 79.3% |
| Irish | 13.2 /100 | #212 | Poor 79.3% |