Immigrants from Syria vs Choctaw In Labor Force | Age 25-29
COMPARE
Immigrants from Syria
Choctaw
In Labor Force | Age 25-29
In Labor Force | Age 25-29 Comparison
Immigrants from Syria
Choctaw
84.3%
IN LABOR FORCE | AGE 25-29
10.7/ 100
METRIC RATING
215th/ 347
METRIC RANK
81.0%
IN LABOR FORCE | AGE 25-29
0.0/ 100
METRIC RATING
326th/ 347
METRIC RANK
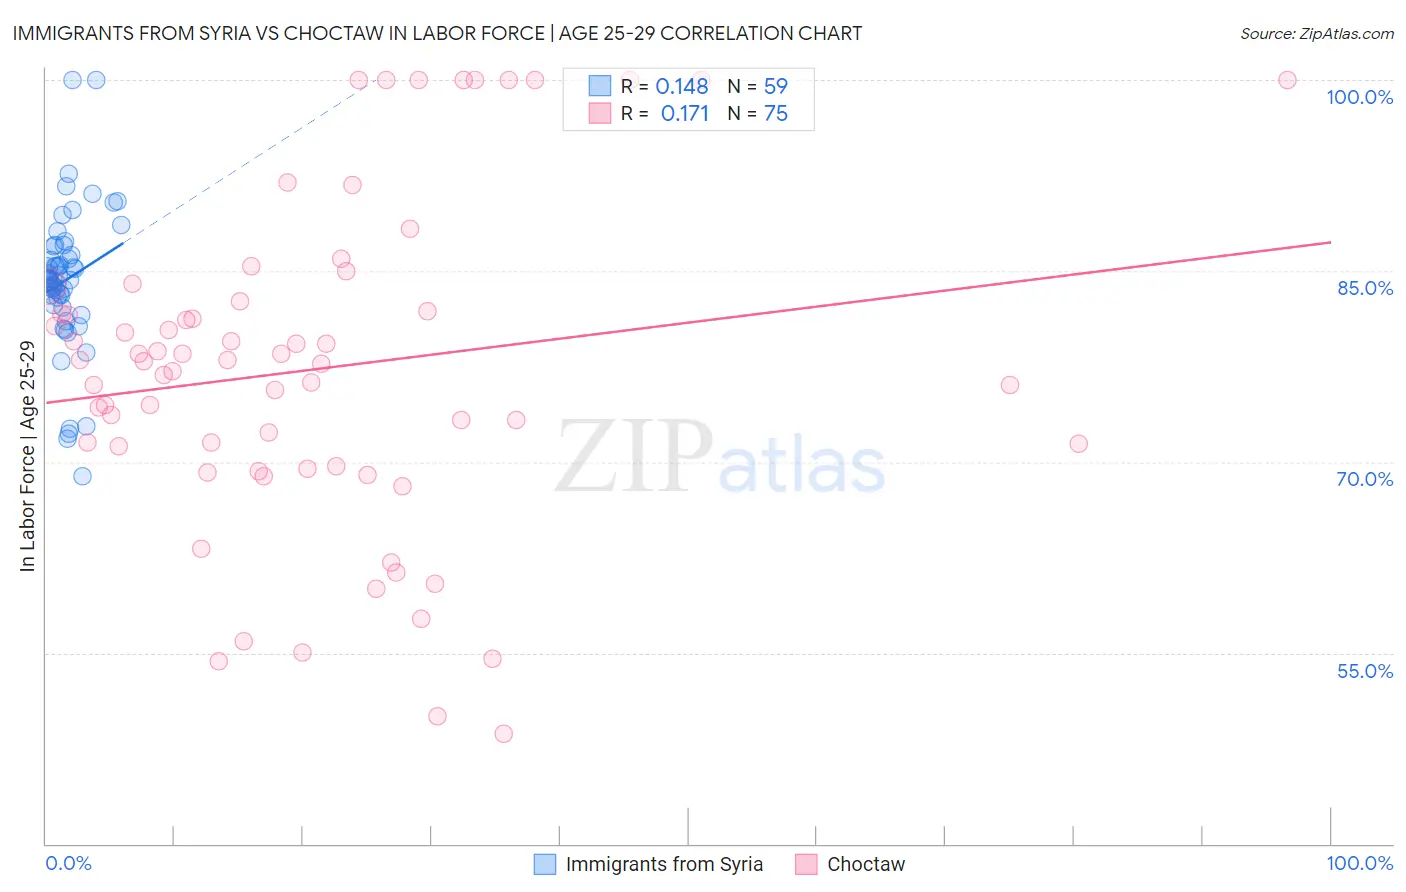
Immigrants from Syria vs Choctaw In Labor Force | Age 25-29 Correlation Chart
The statistical analysis conducted on geographies consisting of 174,092,146 people shows a poor positive correlation between the proportion of Immigrants from Syria and labor force participation rate among population between the ages 25 and 29 in the United States with a correlation coefficient (R) of 0.148 and weighted average of 84.3%. Similarly, the statistical analysis conducted on geographies consisting of 269,623,280 people shows a poor positive correlation between the proportion of Choctaw and labor force participation rate among population between the ages 25 and 29 in the United States with a correlation coefficient (R) of 0.171 and weighted average of 81.0%, a difference of 4.1%.
In Labor Force | Age 25-29 Correlation Summary
| Measurement | Immigrants from Syria | Choctaw |
| Minimum | 68.9% | 48.6% |
| Maximum | 100.0% | 100.0% |
| Range | 31.1% | 51.4% |
| Mean | 84.3% | 77.3% |
| Median | 84.4% | 77.9% |
| Interquartile 25% (IQ1) | 82.4% | 69.7% |
| Interquartile 75% (IQ3) | 86.9% | 82.6% |
| Interquartile Range (IQR) | 4.6% | 12.9% |
| Standard Deviation (Sample) | 5.7% | 12.8% |
| Standard Deviation (Population) | 5.6% | 12.7% |
Similar Demographics by In Labor Force | Age 25-29
Demographics Similar to Immigrants from Syria by In Labor Force | Age 25-29
In terms of in labor force | age 25-29, the demographic groups most similar to Immigrants from Syria are Japanese (84.3%, a difference of 0.010%), Lebanese (84.3%, a difference of 0.010%), Subsaharan African (84.3%, a difference of 0.020%), Chinese (84.3%, a difference of 0.030%), and Immigrants from Venezuela (84.3%, a difference of 0.030%).
| Demographics | Rating | Rank | In Labor Force | Age 25-29 |
| Immigrants | Indonesia | 13.2 /100 | #208 | Poor 84.4% |
| Immigrants | Jordan | 12.8 /100 | #209 | Poor 84.4% |
| Chinese | 12.7 /100 | #210 | Poor 84.3% |
| Immigrants | Venezuela | 12.6 /100 | #211 | Poor 84.3% |
| Sub-Saharan Africans | 11.7 /100 | #212 | Poor 84.3% |
| Japanese | 11.4 /100 | #213 | Poor 84.3% |
| Lebanese | 11.1 /100 | #214 | Poor 84.3% |
| Immigrants | Syria | 10.7 /100 | #215 | Poor 84.3% |
| Israelis | 9.3 /100 | #216 | Tragic 84.3% |
| Immigrants | Ecuador | 9.3 /100 | #217 | Tragic 84.3% |
| Immigrants | Nigeria | 9.0 /100 | #218 | Tragic 84.3% |
| Immigrants | Saudi Arabia | 8.8 /100 | #219 | Tragic 84.3% |
| Nigerians | 7.2 /100 | #220 | Tragic 84.3% |
| Arabs | 6.8 /100 | #221 | Tragic 84.2% |
| Jordanians | 6.7 /100 | #222 | Tragic 84.2% |
Demographics Similar to Choctaw by In Labor Force | Age 25-29
In terms of in labor force | age 25-29, the demographic groups most similar to Choctaw are Dutch West Indian (81.1%, a difference of 0.20%), Ute (80.8%, a difference of 0.20%), Houma (81.2%, a difference of 0.32%), Creek (80.7%, a difference of 0.35%), and Yakama (80.6%, a difference of 0.46%).
| Demographics | Rating | Rank | In Labor Force | Age 25-29 |
| Seminole | 0.0 /100 | #319 | Tragic 81.7% |
| Colville | 0.0 /100 | #320 | Tragic 81.6% |
| Shoshone | 0.0 /100 | #321 | Tragic 81.6% |
| Kiowa | 0.0 /100 | #322 | Tragic 81.6% |
| Alaska Natives | 0.0 /100 | #323 | Tragic 81.6% |
| Houma | 0.0 /100 | #324 | Tragic 81.2% |
| Dutch West Indians | 0.0 /100 | #325 | Tragic 81.1% |
| Choctaw | 0.0 /100 | #326 | Tragic 81.0% |
| Ute | 0.0 /100 | #327 | Tragic 80.8% |
| Creek | 0.0 /100 | #328 | Tragic 80.7% |
| Yakama | 0.0 /100 | #329 | Tragic 80.6% |
| Puerto Ricans | 0.0 /100 | #330 | Tragic 80.4% |
| Cheyenne | 0.0 /100 | #331 | Tragic 80.3% |
| Inupiat | 0.0 /100 | #332 | Tragic 79.8% |
| Sioux | 0.0 /100 | #333 | Tragic 79.7% |