Immigrants from Switzerland vs Hawaiian In Labor Force | Age 45-54
COMPARE
Immigrants from Switzerland
Hawaiian
In Labor Force | Age 45-54
In Labor Force | Age 45-54 Comparison
Immigrants from Switzerland
Hawaiians
82.7%
IN LABOR FORCE | AGE 45-54
39.4/ 100
METRIC RATING
179th/ 347
METRIC RANK
81.5%
IN LABOR FORCE | AGE 45-54
0.1/ 100
METRIC RATING
261st/ 347
METRIC RANK
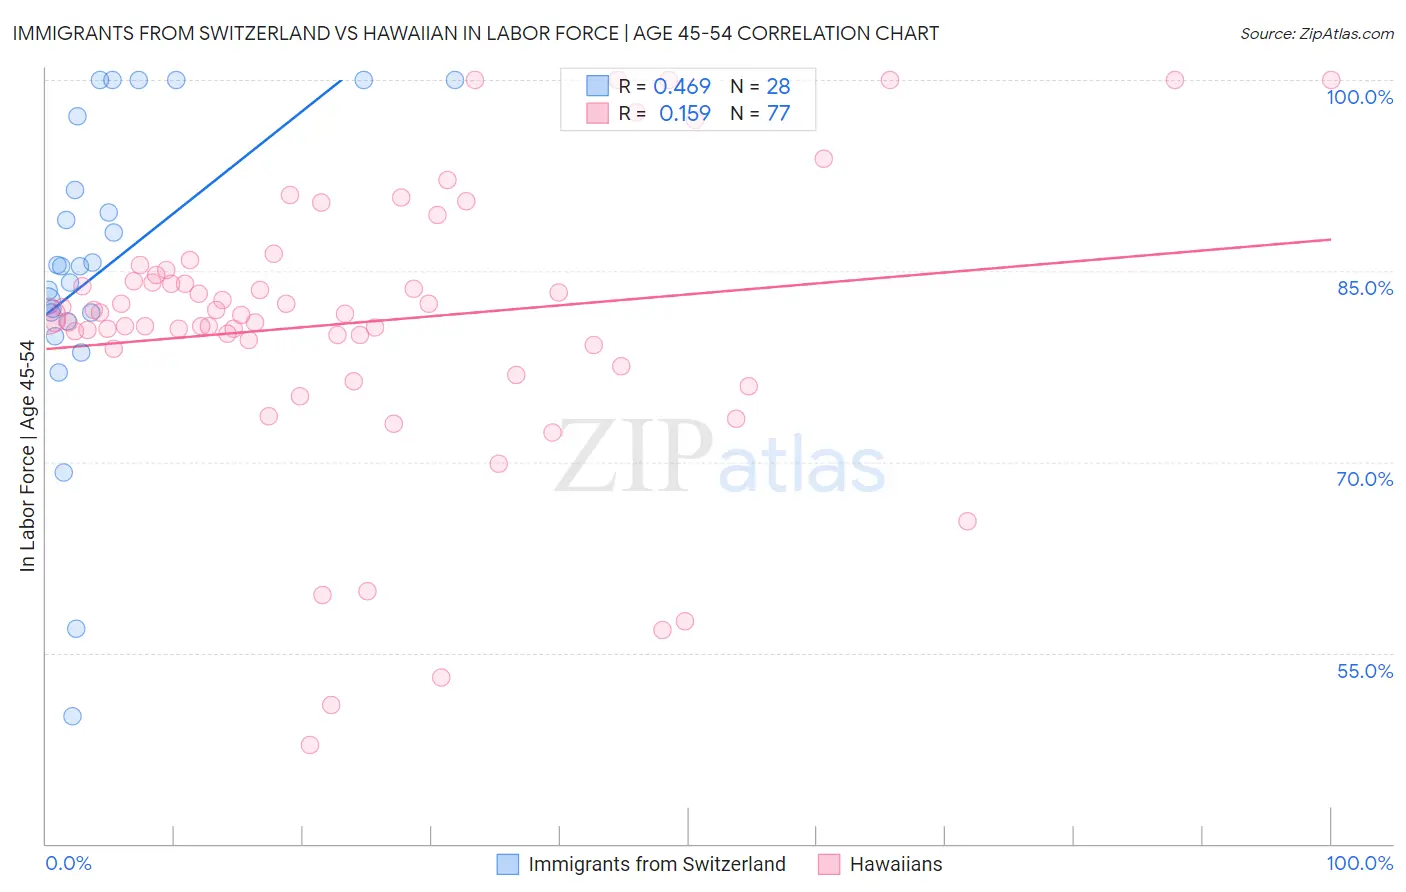
Immigrants from Switzerland vs Hawaiian In Labor Force | Age 45-54 Correlation Chart
The statistical analysis conducted on geographies consisting of 148,071,705 people shows a moderate positive correlation between the proportion of Immigrants from Switzerland and labor force participation rate among population between the ages 45 and 54 in the United States with a correlation coefficient (R) of 0.469 and weighted average of 82.7%. Similarly, the statistical analysis conducted on geographies consisting of 327,376,409 people shows a poor positive correlation between the proportion of Hawaiians and labor force participation rate among population between the ages 45 and 54 in the United States with a correlation coefficient (R) of 0.159 and weighted average of 81.5%, a difference of 1.5%.
In Labor Force | Age 45-54 Correlation Summary
| Measurement | Immigrants from Switzerland | Hawaiian |
| Minimum | 50.0% | 47.8% |
| Maximum | 100.0% | 100.0% |
| Range | 50.0% | 52.2% |
| Mean | 85.2% | 81.0% |
| Median | 85.4% | 81.6% |
| Interquartile 25% (IQ1) | 81.4% | 79.1% |
| Interquartile 75% (IQ3) | 94.3% | 84.8% |
| Interquartile Range (IQR) | 12.9% | 5.8% |
| Standard Deviation (Sample) | 12.2% | 11.0% |
| Standard Deviation (Population) | 12.0% | 10.9% |
Similar Demographics by In Labor Force | Age 45-54
Demographics Similar to Immigrants from Switzerland by In Labor Force | Age 45-54
In terms of in labor force | age 45-54, the demographic groups most similar to Immigrants from Switzerland are Nigerian (82.7%, a difference of 0.010%), Hungarian (82.7%, a difference of 0.010%), Israeli (82.7%, a difference of 0.020%), Immigrants from Hungary (82.7%, a difference of 0.020%), and Immigrants from Nicaragua (82.7%, a difference of 0.050%).
| Demographics | Rating | Rank | In Labor Force | Age 45-54 |
| Icelanders | 51.8 /100 | #172 | Average 82.8% |
| Nicaraguans | 50.3 /100 | #173 | Average 82.8% |
| Costa Ricans | 50.0 /100 | #174 | Average 82.8% |
| Immigrants | Liberia | 47.9 /100 | #175 | Average 82.7% |
| Northern Europeans | 46.9 /100 | #176 | Average 82.7% |
| Immigrants | Nicaragua | 44.6 /100 | #177 | Average 82.7% |
| Nigerians | 40.5 /100 | #178 | Average 82.7% |
| Immigrants | Switzerland | 39.4 /100 | #179 | Fair 82.7% |
| Hungarians | 38.0 /100 | #180 | Fair 82.7% |
| Israelis | 37.7 /100 | #181 | Fair 82.7% |
| Immigrants | Hungary | 37.1 /100 | #182 | Fair 82.7% |
| New Zealanders | 32.7 /100 | #183 | Fair 82.6% |
| Europeans | 32.6 /100 | #184 | Fair 82.6% |
| Immigrants | England | 32.2 /100 | #185 | Fair 82.6% |
| Irish | 29.2 /100 | #186 | Fair 82.6% |
Demographics Similar to Hawaiians by In Labor Force | Age 45-54
In terms of in labor force | age 45-54, the demographic groups most similar to Hawaiians are Immigrants from Guyana (81.5%, a difference of 0.0%), Indonesian (81.5%, a difference of 0.010%), Spaniard (81.5%, a difference of 0.020%), Immigrants from West Indies (81.5%, a difference of 0.020%), and Guyanese (81.5%, a difference of 0.040%).
| Demographics | Rating | Rank | In Labor Force | Age 45-54 |
| Immigrants | Laos | 0.2 /100 | #254 | Tragic 81.6% |
| Scotch-Irish | 0.2 /100 | #255 | Tragic 81.6% |
| Barbadians | 0.1 /100 | #256 | Tragic 81.6% |
| Immigrants | Congo | 0.1 /100 | #257 | Tragic 81.6% |
| Immigrants | Fiji | 0.1 /100 | #258 | Tragic 81.5% |
| Guyanese | 0.1 /100 | #259 | Tragic 81.5% |
| Spaniards | 0.1 /100 | #260 | Tragic 81.5% |
| Hawaiians | 0.1 /100 | #261 | Tragic 81.5% |
| Immigrants | Guyana | 0.1 /100 | #262 | Tragic 81.5% |
| Indonesians | 0.1 /100 | #263 | Tragic 81.5% |
| Immigrants | West Indies | 0.1 /100 | #264 | Tragic 81.5% |
| Hondurans | 0.1 /100 | #265 | Tragic 81.4% |
| Immigrants | St. Vincent and the Grenadines | 0.1 /100 | #266 | Tragic 81.4% |
| West Indians | 0.1 /100 | #267 | Tragic 81.4% |
| Immigrants | Honduras | 0.0 /100 | #268 | Tragic 81.4% |