Immigrants from Switzerland vs Hispanic or Latino In Labor Force | Age 35-44
COMPARE
Immigrants from Switzerland
Hispanic or Latino
In Labor Force | Age 35-44
In Labor Force | Age 35-44 Comparison
Immigrants from Switzerland
Hispanics or Latinos
84.5%
IN LABOR FORCE | AGE 35-44
65.9/ 100
METRIC RATING
155th/ 347
METRIC RANK
82.1%
IN LABOR FORCE | AGE 35-44
0.0/ 100
METRIC RATING
307th/ 347
METRIC RANK
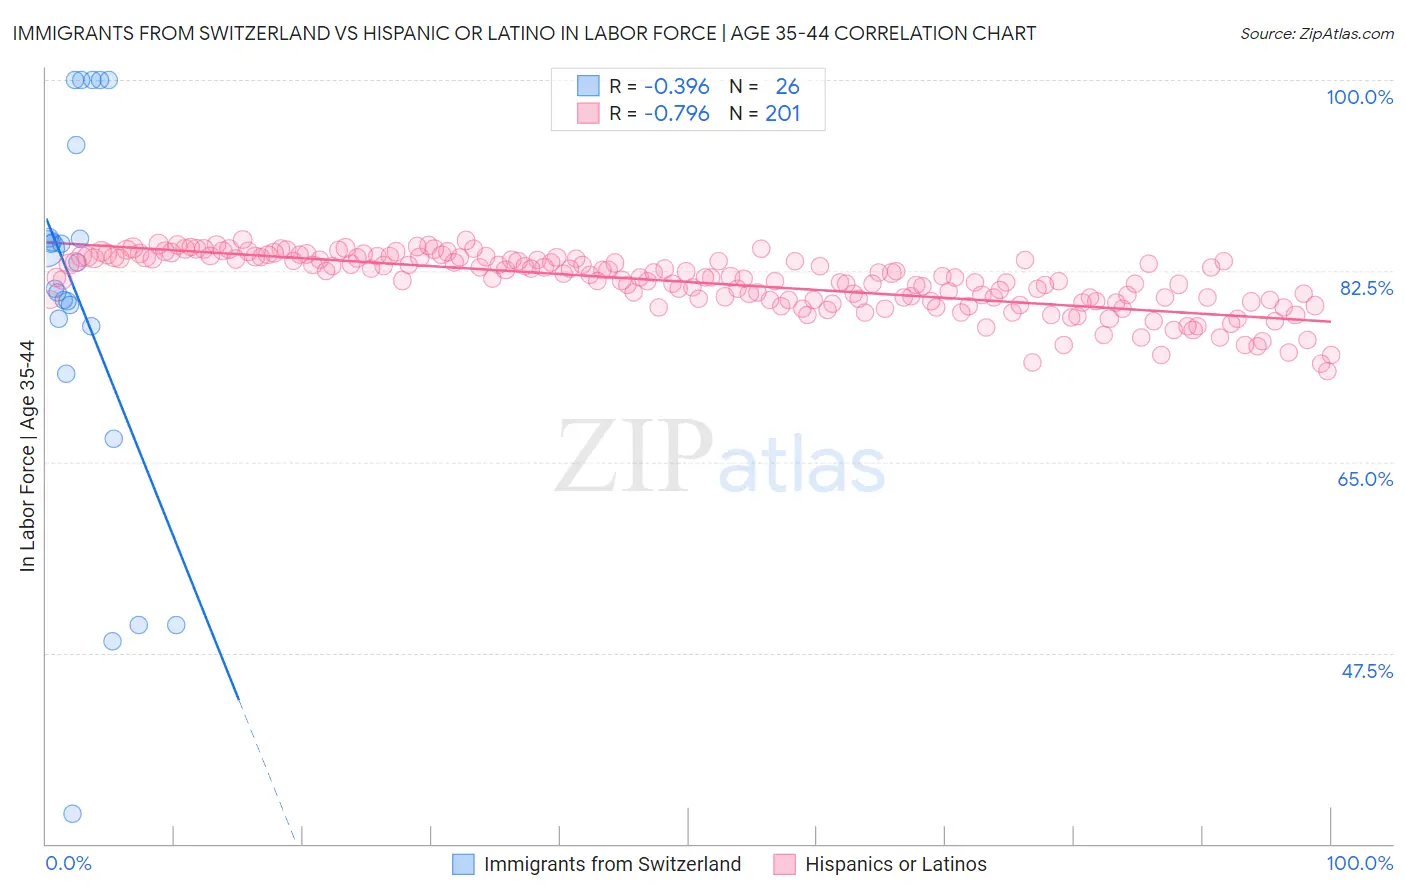
Immigrants from Switzerland vs Hispanic or Latino In Labor Force | Age 35-44 Correlation Chart
The statistical analysis conducted on geographies consisting of 148,071,770 people shows a mild negative correlation between the proportion of Immigrants from Switzerland and labor force participation rate among population between the ages 35 and 44 in the United States with a correlation coefficient (R) of -0.396 and weighted average of 84.5%. Similarly, the statistical analysis conducted on geographies consisting of 577,755,935 people shows a strong negative correlation between the proportion of Hispanics or Latinos and labor force participation rate among population between the ages 35 and 44 in the United States with a correlation coefficient (R) of -0.796 and weighted average of 82.1%, a difference of 2.9%.
In Labor Force | Age 35-44 Correlation Summary
| Measurement | Immigrants from Switzerland | Hispanic or Latino |
| Minimum | 32.7% | 73.3% |
| Maximum | 100.0% | 85.4% |
| Range | 67.3% | 12.1% |
| Mean | 79.4% | 81.5% |
| Median | 82.1% | 81.9% |
| Interquartile 25% (IQ1) | 77.4% | 79.8% |
| Interquartile 75% (IQ3) | 85.5% | 83.7% |
| Interquartile Range (IQR) | 8.1% | 3.9% |
| Standard Deviation (Sample) | 17.4% | 2.7% |
| Standard Deviation (Population) | 17.1% | 2.6% |
Similar Demographics by In Labor Force | Age 35-44
Demographics Similar to Immigrants from Switzerland by In Labor Force | Age 35-44
In terms of in labor force | age 35-44, the demographic groups most similar to Immigrants from Switzerland are Immigrants from Israel (84.4%, a difference of 0.010%), Immigrants from Austria (84.4%, a difference of 0.010%), Jamaican (84.4%, a difference of 0.020%), Trinidadian and Tobagonian (84.5%, a difference of 0.030%), and Iranian (84.5%, a difference of 0.030%).
| Demographics | Rating | Rank | In Labor Force | Age 35-44 |
| South American Indians | 73.6 /100 | #148 | Good 84.5% |
| Okinawans | 73.5 /100 | #149 | Good 84.5% |
| Immigrants | Nigeria | 73.3 /100 | #150 | Good 84.5% |
| Romanians | 72.1 /100 | #151 | Good 84.5% |
| Immigrants | Taiwan | 71.4 /100 | #152 | Good 84.5% |
| Trinidadians and Tobagonians | 69.5 /100 | #153 | Good 84.5% |
| Iranians | 69.4 /100 | #154 | Good 84.5% |
| Immigrants | Switzerland | 65.9 /100 | #155 | Good 84.5% |
| Immigrants | Israel | 64.3 /100 | #156 | Good 84.4% |
| Immigrants | Austria | 63.8 /100 | #157 | Good 84.4% |
| Jamaicans | 62.7 /100 | #158 | Good 84.4% |
| Immigrants | Senegal | 60.4 /100 | #159 | Good 84.4% |
| Immigrants | Kazakhstan | 60.4 /100 | #160 | Good 84.4% |
| Immigrants | Venezuela | 60.0 /100 | #161 | Good 84.4% |
| Immigrants | Hungary | 59.4 /100 | #162 | Average 84.4% |
Demographics Similar to Hispanics or Latinos by In Labor Force | Age 35-44
In terms of in labor force | age 35-44, the demographic groups most similar to Hispanics or Latinos are Black/African American (82.2%, a difference of 0.10%), Shoshone (82.2%, a difference of 0.12%), Immigrants from Central America (82.0%, a difference of 0.15%), Cree (82.0%, a difference of 0.15%), and Blackfeet (81.9%, a difference of 0.28%).
| Demographics | Rating | Rank | In Labor Force | Age 35-44 |
| Central American Indians | 0.0 /100 | #300 | Tragic 82.5% |
| Spanish American Indians | 0.0 /100 | #301 | Tragic 82.5% |
| Americans | 0.0 /100 | #302 | Tragic 82.4% |
| Nepalese | 0.0 /100 | #303 | Tragic 82.4% |
| Marshallese | 0.0 /100 | #304 | Tragic 82.4% |
| Shoshone | 0.0 /100 | #305 | Tragic 82.2% |
| Blacks/African Americans | 0.0 /100 | #306 | Tragic 82.2% |
| Hispanics or Latinos | 0.0 /100 | #307 | Tragic 82.1% |
| Immigrants | Central America | 0.0 /100 | #308 | Tragic 82.0% |
| Cree | 0.0 /100 | #309 | Tragic 82.0% |
| Blackfeet | 0.0 /100 | #310 | Tragic 81.9% |
| Colville | 0.0 /100 | #311 | Tragic 81.7% |
| Alaska Natives | 0.0 /100 | #312 | Tragic 81.6% |
| Mexicans | 0.0 /100 | #313 | Tragic 81.6% |
| Cajuns | 0.0 /100 | #314 | Tragic 81.5% |