Immigrants from Switzerland vs Immigrants from Scotland In Labor Force | Age 35-44
COMPARE
Immigrants from Switzerland
Immigrants from Scotland
In Labor Force | Age 35-44
In Labor Force | Age 35-44 Comparison
Immigrants from Switzerland
Immigrants from Scotland
84.5%
IN LABOR FORCE | AGE 35-44
65.9/ 100
METRIC RATING
155th/ 347
METRIC RANK
84.7%
IN LABOR FORCE | AGE 35-44
89.6/ 100
METRIC RATING
131st/ 347
METRIC RANK
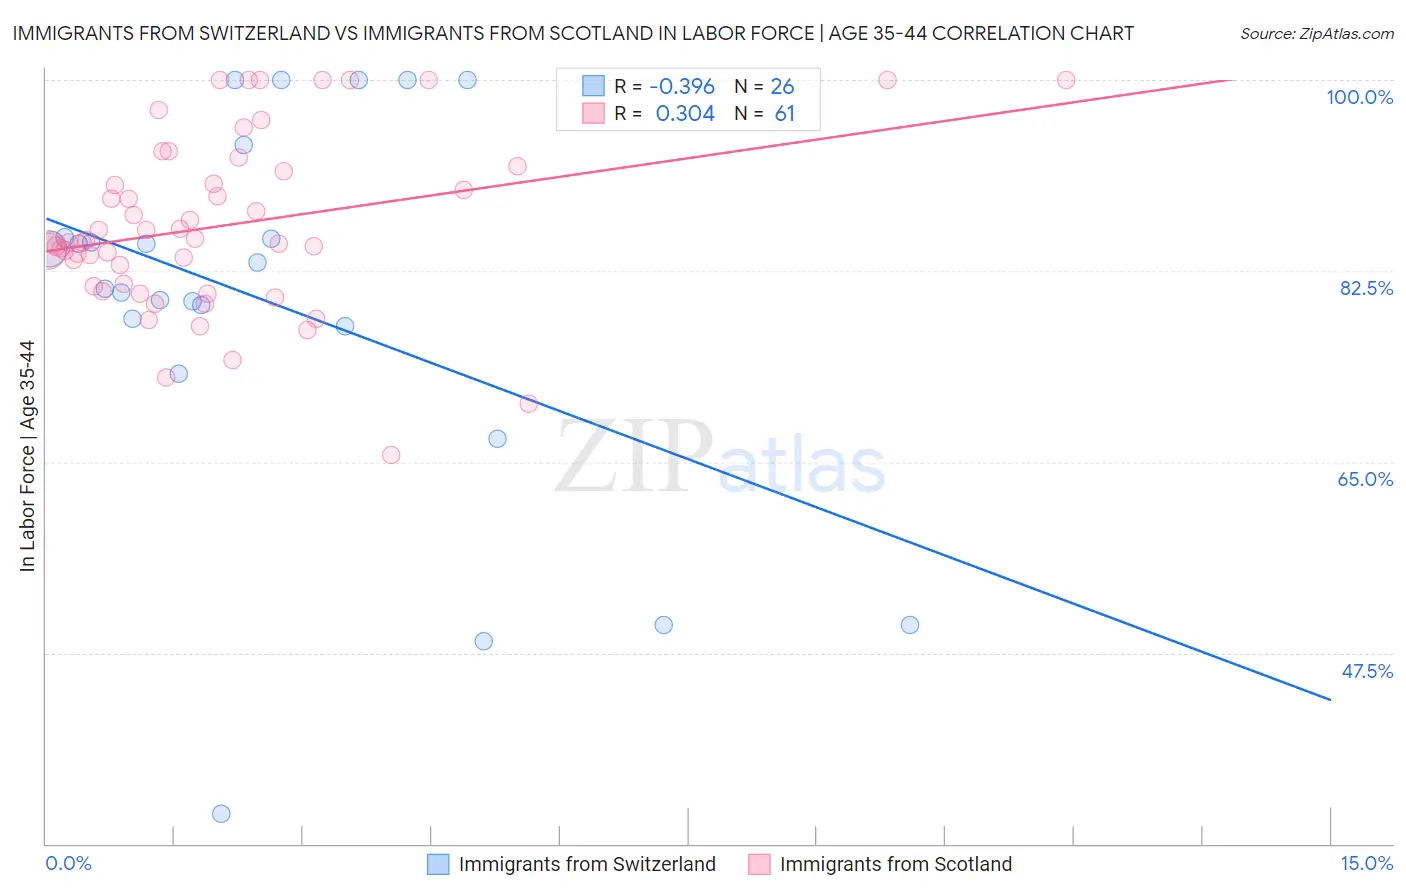
Immigrants from Switzerland vs Immigrants from Scotland In Labor Force | Age 35-44 Correlation Chart
The statistical analysis conducted on geographies consisting of 148,071,770 people shows a mild negative correlation between the proportion of Immigrants from Switzerland and labor force participation rate among population between the ages 35 and 44 in the United States with a correlation coefficient (R) of -0.396 and weighted average of 84.5%. Similarly, the statistical analysis conducted on geographies consisting of 196,377,441 people shows a mild positive correlation between the proportion of Immigrants from Scotland and labor force participation rate among population between the ages 35 and 44 in the United States with a correlation coefficient (R) of 0.304 and weighted average of 84.7%, a difference of 0.24%.
In Labor Force | Age 35-44 Correlation Summary
| Measurement | Immigrants from Switzerland | Immigrants from Scotland |
| Minimum | 32.7% | 65.7% |
| Maximum | 100.0% | 100.0% |
| Range | 67.3% | 34.3% |
| Mean | 79.4% | 86.7% |
| Median | 82.1% | 85.1% |
| Interquartile 25% (IQ1) | 77.4% | 81.2% |
| Interquartile 75% (IQ3) | 85.5% | 91.9% |
| Interquartile Range (IQR) | 8.1% | 10.7% |
| Standard Deviation (Sample) | 17.4% | 7.9% |
| Standard Deviation (Population) | 17.1% | 7.8% |
Similar Demographics by In Labor Force | Age 35-44
Demographics Similar to Immigrants from Switzerland by In Labor Force | Age 35-44
In terms of in labor force | age 35-44, the demographic groups most similar to Immigrants from Switzerland are Immigrants from Israel (84.4%, a difference of 0.010%), Immigrants from Austria (84.4%, a difference of 0.010%), Jamaican (84.4%, a difference of 0.020%), Trinidadian and Tobagonian (84.5%, a difference of 0.030%), and Iranian (84.5%, a difference of 0.030%).
| Demographics | Rating | Rank | In Labor Force | Age 35-44 |
| South American Indians | 73.6 /100 | #148 | Good 84.5% |
| Okinawans | 73.5 /100 | #149 | Good 84.5% |
| Immigrants | Nigeria | 73.3 /100 | #150 | Good 84.5% |
| Romanians | 72.1 /100 | #151 | Good 84.5% |
| Immigrants | Taiwan | 71.4 /100 | #152 | Good 84.5% |
| Trinidadians and Tobagonians | 69.5 /100 | #153 | Good 84.5% |
| Iranians | 69.4 /100 | #154 | Good 84.5% |
| Immigrants | Switzerland | 65.9 /100 | #155 | Good 84.5% |
| Immigrants | Israel | 64.3 /100 | #156 | Good 84.4% |
| Immigrants | Austria | 63.8 /100 | #157 | Good 84.4% |
| Jamaicans | 62.7 /100 | #158 | Good 84.4% |
| Immigrants | Senegal | 60.4 /100 | #159 | Good 84.4% |
| Immigrants | Kazakhstan | 60.4 /100 | #160 | Good 84.4% |
| Immigrants | Venezuela | 60.0 /100 | #161 | Good 84.4% |
| Immigrants | Hungary | 59.4 /100 | #162 | Average 84.4% |
Demographics Similar to Immigrants from Scotland by In Labor Force | Age 35-44
In terms of in labor force | age 35-44, the demographic groups most similar to Immigrants from Scotland are Palestinian (84.7%, a difference of 0.0%), Bhutanese (84.7%, a difference of 0.0%), Austrian (84.7%, a difference of 0.0%), Immigrants from Ghana (84.7%, a difference of 0.010%), and Slavic (84.7%, a difference of 0.020%).
| Demographics | Rating | Rank | In Labor Force | Age 35-44 |
| Slavs | 90.8 /100 | #124 | Exceptional 84.7% |
| Maltese | 90.8 /100 | #125 | Exceptional 84.7% |
| Asians | 90.6 /100 | #126 | Exceptional 84.7% |
| Immigrants | Spain | 90.6 /100 | #127 | Exceptional 84.7% |
| Immigrants | Ghana | 90.4 /100 | #128 | Exceptional 84.7% |
| Palestinians | 89.7 /100 | #129 | Excellent 84.7% |
| Bhutanese | 89.7 /100 | #130 | Excellent 84.7% |
| Immigrants | Scotland | 89.6 /100 | #131 | Excellent 84.7% |
| Austrians | 89.4 /100 | #132 | Excellent 84.7% |
| Argentineans | 88.4 /100 | #133 | Excellent 84.6% |
| Immigrants | Korea | 88.2 /100 | #134 | Excellent 84.6% |
| Immigrants | Malaysia | 87.5 /100 | #135 | Excellent 84.6% |
| Afghans | 86.3 /100 | #136 | Excellent 84.6% |
| Immigrants | Chile | 84.6 /100 | #137 | Excellent 84.6% |
| Czechoslovakians | 82.6 /100 | #138 | Excellent 84.6% |