Spaniard vs Immigrants from Europe In Labor Force | Age 16-19
COMPARE
Spaniard
Immigrants from Europe
In Labor Force | Age 16-19
In Labor Force | Age 16-19 Comparison
Spaniards
Immigrants from Europe
38.0%
IN LABOR FORCE | AGE 16-19
95.5/ 100
METRIC RATING
129th/ 347
METRIC RANK
36.2%
IN LABOR FORCE | AGE 16-19
31.8/ 100
METRIC RATING
188th/ 347
METRIC RANK
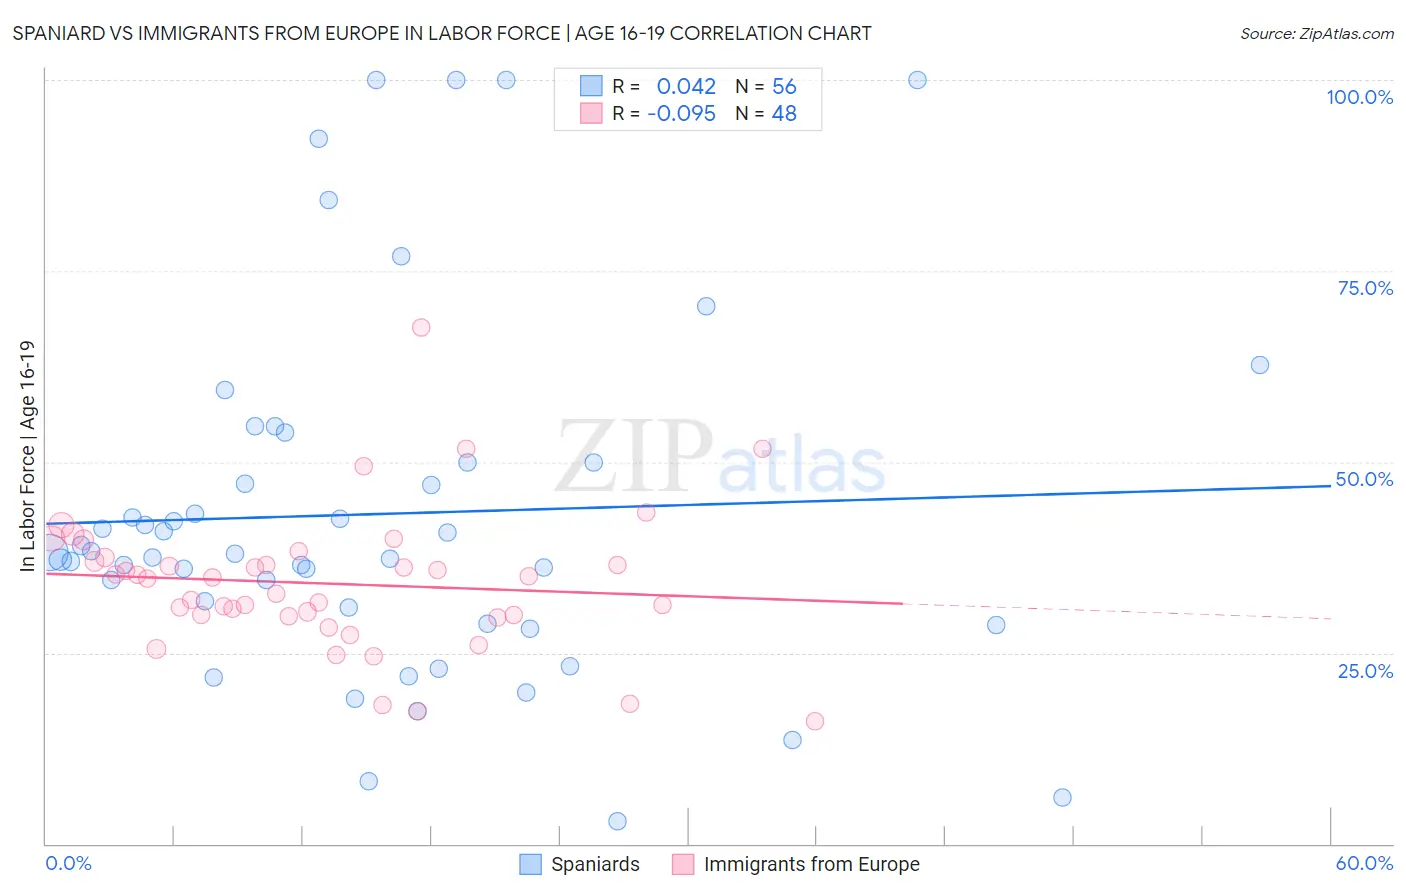
Spaniard vs Immigrants from Europe In Labor Force | Age 16-19 Correlation Chart
The statistical analysis conducted on geographies consisting of 442,456,535 people shows no correlation between the proportion of Spaniards and labor force participation rate among population between the ages 16 and 19 in the United States with a correlation coefficient (R) of 0.042 and weighted average of 38.0%. Similarly, the statistical analysis conducted on geographies consisting of 544,647,771 people shows a slight negative correlation between the proportion of Immigrants from Europe and labor force participation rate among population between the ages 16 and 19 in the United States with a correlation coefficient (R) of -0.095 and weighted average of 36.2%, a difference of 4.9%.
In Labor Force | Age 16-19 Correlation Summary
| Measurement | Spaniard | Immigrants from Europe |
| Minimum | 3.0% | 16.1% |
| Maximum | 100.0% | 67.6% |
| Range | 97.0% | 51.5% |
| Mean | 43.2% | 34.1% |
| Median | 38.1% | 34.8% |
| Interquartile 25% (IQ1) | 29.9% | 29.9% |
| Interquartile 75% (IQ3) | 50.0% | 37.2% |
| Interquartile Range (IQR) | 20.1% | 7.3% |
| Standard Deviation (Sample) | 23.4% | 9.2% |
| Standard Deviation (Population) | 23.2% | 9.1% |
Similar Demographics by In Labor Force | Age 16-19
Demographics Similar to Spaniards by In Labor Force | Age 16-19
In terms of in labor force | age 16-19, the demographic groups most similar to Spaniards are New Zealander (38.0%, a difference of 0.020%), African (38.0%, a difference of 0.030%), Choctaw (38.0%, a difference of 0.030%), Immigrants from Zimbabwe (38.0%, a difference of 0.030%), and Immigrants from Austria (37.9%, a difference of 0.12%).
| Demographics | Rating | Rank | In Labor Force | Age 16-19 |
| Guamanians/Chamorros | 97.4 /100 | #122 | Exceptional 38.2% |
| Seminole | 96.7 /100 | #123 | Exceptional 38.1% |
| Immigrants | England | 96.4 /100 | #124 | Exceptional 38.1% |
| Immigrants | Africa | 96.1 /100 | #125 | Exceptional 38.0% |
| Africans | 95.6 /100 | #126 | Exceptional 38.0% |
| Choctaw | 95.6 /100 | #127 | Exceptional 38.0% |
| New Zealanders | 95.6 /100 | #128 | Exceptional 38.0% |
| Spaniards | 95.5 /100 | #129 | Exceptional 38.0% |
| Immigrants | Zimbabwe | 95.4 /100 | #130 | Exceptional 38.0% |
| Immigrants | Austria | 95.0 /100 | #131 | Exceptional 37.9% |
| Immigrants | Oceania | 94.7 /100 | #132 | Exceptional 37.9% |
| Cheyenne | 94.6 /100 | #133 | Exceptional 37.9% |
| Immigrants | Netherlands | 93.7 /100 | #134 | Exceptional 37.8% |
| Macedonians | 93.4 /100 | #135 | Exceptional 37.8% |
| Australians | 93.2 /100 | #136 | Exceptional 37.8% |
Demographics Similar to Immigrants from Europe by In Labor Force | Age 16-19
In terms of in labor force | age 16-19, the demographic groups most similar to Immigrants from Europe are Immigrants from Romania (36.3%, a difference of 0.13%), Immigrants from Afghanistan (36.3%, a difference of 0.13%), Immigrants from Hungary (36.2%, a difference of 0.18%), Panamanian (36.1%, a difference of 0.19%), and Bhutanese (36.3%, a difference of 0.20%).
| Demographics | Rating | Rank | In Labor Force | Age 16-19 |
| Jordanians | 39.6 /100 | #181 | Fair 36.4% |
| Immigrants | Italy | 39.1 /100 | #182 | Fair 36.4% |
| Eastern Europeans | 38.8 /100 | #183 | Fair 36.4% |
| Costa Ricans | 36.1 /100 | #184 | Fair 36.3% |
| Bhutanese | 35.3 /100 | #185 | Fair 36.3% |
| Immigrants | Romania | 34.0 /100 | #186 | Fair 36.3% |
| Immigrants | Afghanistan | 34.0 /100 | #187 | Fair 36.3% |
| Immigrants | Europe | 31.8 /100 | #188 | Fair 36.2% |
| Immigrants | Hungary | 28.8 /100 | #189 | Fair 36.2% |
| Panamanians | 28.6 /100 | #190 | Fair 36.1% |
| Immigrants | Croatia | 27.5 /100 | #191 | Fair 36.1% |
| Afghans | 25.7 /100 | #192 | Fair 36.1% |
| Immigrants | Denmark | 25.0 /100 | #193 | Fair 36.1% |
| Nigerians | 24.6 /100 | #194 | Fair 36.1% |
| Bolivians | 23.3 /100 | #195 | Fair 36.0% |