Immigrants from Sweden vs Yugoslavian Disability Age 65 to 74
COMPARE
Immigrants from Sweden
Yugoslavian
Disability Age 65 to 74
Disability Age 65 to 74 Comparison
Immigrants from Sweden
Yugoslavians
21.0%
DISABILITY AGE 65 TO 74
99.9/ 100
METRIC RATING
27th/ 347
METRIC RANK
23.3%
DISABILITY AGE 65 TO 74
50.2/ 100
METRIC RATING
173rd/ 347
METRIC RANK
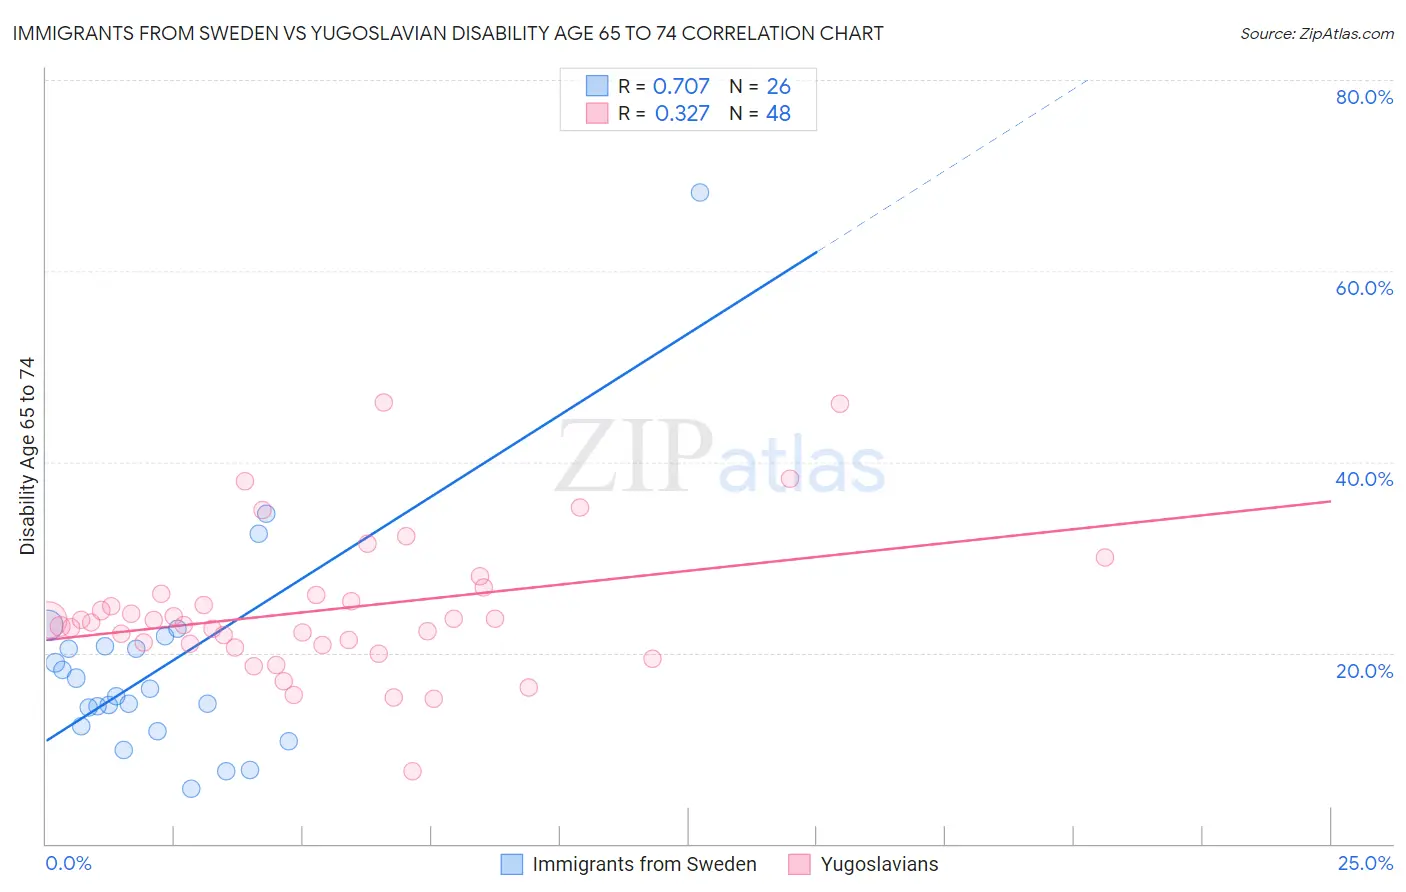
Immigrants from Sweden vs Yugoslavian Disability Age 65 to 74 Correlation Chart
The statistical analysis conducted on geographies consisting of 164,619,095 people shows a strong positive correlation between the proportion of Immigrants from Sweden and percentage of population with a disability between the ages 65 and 75 in the United States with a correlation coefficient (R) of 0.707 and weighted average of 21.0%. Similarly, the statistical analysis conducted on geographies consisting of 285,430,434 people shows a mild positive correlation between the proportion of Yugoslavians and percentage of population with a disability between the ages 65 and 75 in the United States with a correlation coefficient (R) of 0.327 and weighted average of 23.3%, a difference of 11.2%.
Disability Age 65 to 74 Correlation Summary
| Measurement | Immigrants from Sweden | Yugoslavian |
| Minimum | 5.7% | 7.5% |
| Maximum | 68.2% | 46.2% |
| Range | 62.5% | 38.7% |
| Mean | 18.8% | 24.5% |
| Median | 15.8% | 23.3% |
| Interquartile 25% (IQ1) | 12.3% | 20.9% |
| Interquartile 75% (IQ3) | 20.7% | 26.1% |
| Interquartile Range (IQR) | 8.4% | 5.2% |
| Standard Deviation (Sample) | 12.2% | 7.4% |
| Standard Deviation (Population) | 11.9% | 7.3% |
Similar Demographics by Disability Age 65 to 74
Demographics Similar to Immigrants from Sweden by Disability Age 65 to 74
In terms of disability age 65 to 74, the demographic groups most similar to Immigrants from Sweden are Immigrants from Australia (21.0%, a difference of 0.020%), Bolivian (21.0%, a difference of 0.030%), Soviet Union (21.0%, a difference of 0.080%), Immigrants from Czechoslovakia (21.0%, a difference of 0.10%), and Immigrants from Belgium (21.0%, a difference of 0.12%).
| Demographics | Rating | Rank | Disability Age 65 to 74 |
| Okinawans | 100.0 /100 | #20 | Exceptional 20.7% |
| Immigrants | Bolivia | 99.9 /100 | #21 | Exceptional 20.8% |
| Immigrants | Iran | 99.9 /100 | #22 | Exceptional 20.9% |
| Immigrants | Belgium | 99.9 /100 | #23 | Exceptional 21.0% |
| Soviet Union | 99.9 /100 | #24 | Exceptional 21.0% |
| Bolivians | 99.9 /100 | #25 | Exceptional 21.0% |
| Immigrants | Australia | 99.9 /100 | #26 | Exceptional 21.0% |
| Immigrants | Sweden | 99.9 /100 | #27 | Exceptional 21.0% |
| Immigrants | Czechoslovakia | 99.9 /100 | #28 | Exceptional 21.0% |
| Immigrants | Japan | 99.9 /100 | #29 | Exceptional 21.0% |
| Immigrants | Greece | 99.9 /100 | #30 | Exceptional 21.0% |
| Immigrants | Northern Europe | 99.9 /100 | #31 | Exceptional 21.0% |
| Turks | 99.9 /100 | #32 | Exceptional 21.0% |
| Immigrants | Argentina | 99.9 /100 | #33 | Exceptional 21.1% |
| Immigrants | Sri Lanka | 99.9 /100 | #34 | Exceptional 21.1% |
Demographics Similar to Yugoslavians by Disability Age 65 to 74
In terms of disability age 65 to 74, the demographic groups most similar to Yugoslavians are Immigrants from South Eastern Asia (23.3%, a difference of 0.010%), German (23.3%, a difference of 0.020%), Dutch (23.3%, a difference of 0.050%), Cuban (23.3%, a difference of 0.10%), and Immigrants from Eritrea (23.4%, a difference of 0.15%).
| Demographics | Rating | Rank | Disability Age 65 to 74 |
| Immigrants | Afghanistan | 60.5 /100 | #166 | Good 23.2% |
| Immigrants | Bosnia and Herzegovina | 57.6 /100 | #167 | Average 23.2% |
| Pakistanis | 57.0 /100 | #168 | Average 23.2% |
| Icelanders | 54.3 /100 | #169 | Average 23.3% |
| Moroccans | 54.2 /100 | #170 | Average 23.3% |
| Cubans | 51.9 /100 | #171 | Average 23.3% |
| Germans | 50.5 /100 | #172 | Average 23.3% |
| Yugoslavians | 50.2 /100 | #173 | Average 23.3% |
| Immigrants | South Eastern Asia | 50.0 /100 | #174 | Average 23.3% |
| Dutch | 49.4 /100 | #175 | Average 23.3% |
| Immigrants | Eritrea | 47.5 /100 | #176 | Average 23.4% |
| Immigrants | Haiti | 47.5 /100 | #177 | Average 23.4% |
| Guyanese | 45.8 /100 | #178 | Average 23.4% |
| Immigrants | Sierra Leone | 45.8 /100 | #179 | Average 23.4% |
| Scandinavians | 45.6 /100 | #180 | Average 23.4% |