Immigrants from Middle Africa vs Immigrants from Western Europe In Labor Force | Age 16-19
COMPARE
Immigrants from Middle Africa
Immigrants from Western Europe
In Labor Force | Age 16-19
In Labor Force | Age 16-19 Comparison
Immigrants from Middle Africa
Immigrants from Western Europe
39.9%
IN LABOR FORCE | AGE 16-19
99.9/ 100
METRIC RATING
73rd/ 347
METRIC RANK
37.5%
IN LABOR FORCE | AGE 16-19
88.9/ 100
METRIC RATING
146th/ 347
METRIC RANK
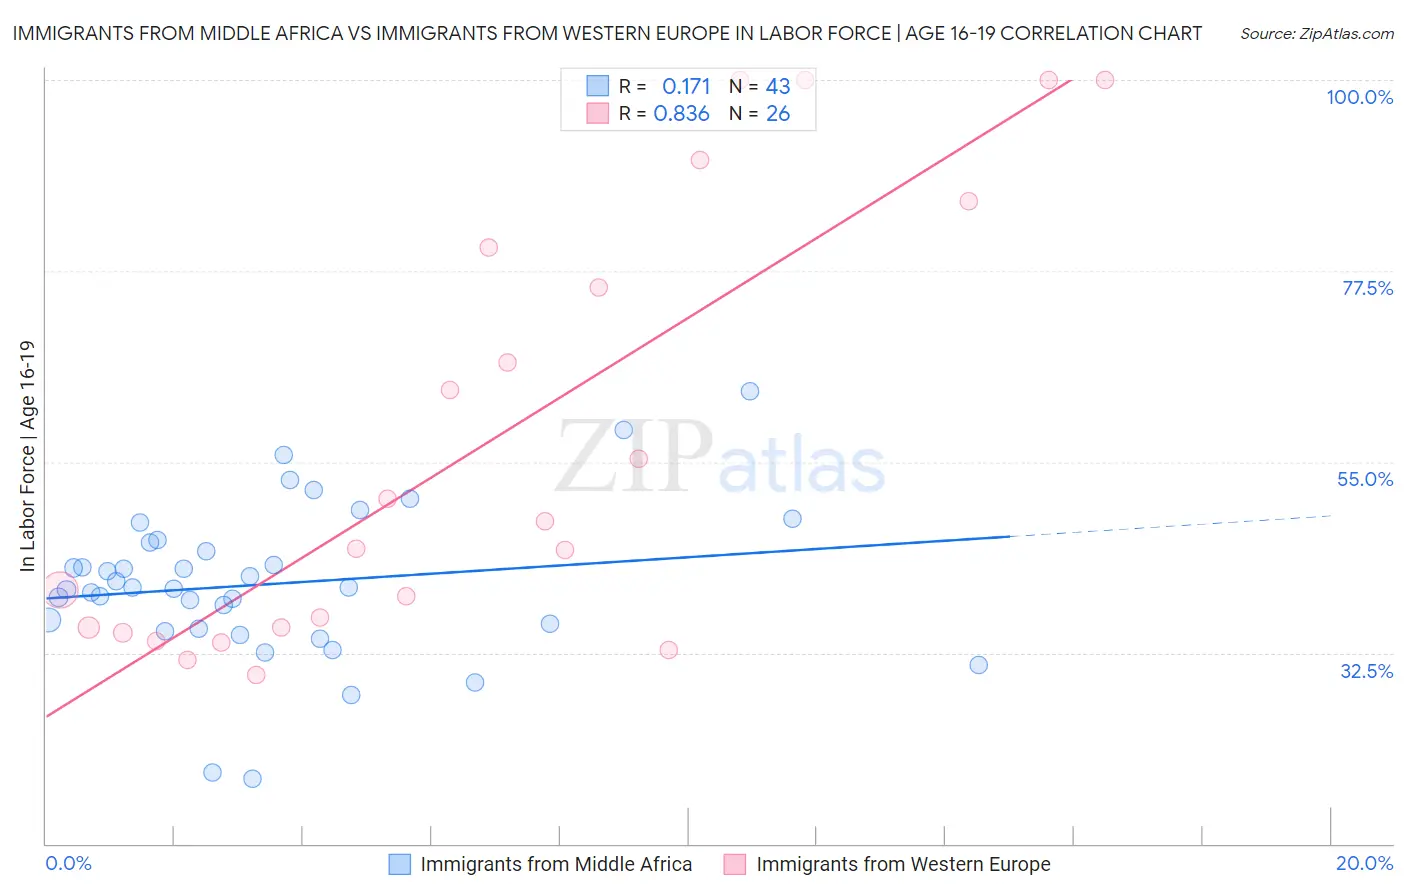
Immigrants from Middle Africa vs Immigrants from Western Europe In Labor Force | Age 16-19 Correlation Chart
The statistical analysis conducted on geographies consisting of 202,678,432 people shows a poor positive correlation between the proportion of Immigrants from Middle Africa and labor force participation rate among population between the ages 16 and 19 in the United States with a correlation coefficient (R) of 0.171 and weighted average of 39.9%. Similarly, the statistical analysis conducted on geographies consisting of 492,395,193 people shows a very strong positive correlation between the proportion of Immigrants from Western Europe and labor force participation rate among population between the ages 16 and 19 in the United States with a correlation coefficient (R) of 0.836 and weighted average of 37.5%, a difference of 6.4%.
In Labor Force | Age 16-19 Correlation Summary
| Measurement | Immigrants from Middle Africa | Immigrants from Western Europe |
| Minimum | 17.7% | 29.8% |
| Maximum | 63.3% | 100.0% |
| Range | 45.6% | 70.2% |
| Mean | 40.6% | 57.3% |
| Median | 40.1% | 46.3% |
| Interquartile 25% (IQ1) | 35.3% | 35.5% |
| Interquartile 75% (IQ3) | 45.4% | 80.2% |
| Interquartile Range (IQR) | 10.1% | 44.7% |
| Standard Deviation (Sample) | 9.1% | 25.5% |
| Standard Deviation (Population) | 9.0% | 25.0% |
Similar Demographics by In Labor Force | Age 16-19
Demographics Similar to Immigrants from Middle Africa by In Labor Force | Age 16-19
In terms of in labor force | age 16-19, the demographic groups most similar to Immigrants from Middle Africa are Iroquois (39.9%, a difference of 0.030%), Serbian (39.9%, a difference of 0.040%), Portuguese (40.0%, a difference of 0.21%), Hungarian (39.8%, a difference of 0.23%), and French American Indian (39.8%, a difference of 0.25%).
| Demographics | Rating | Rank | In Labor Force | Age 16-19 |
| Immigrants | Nonimmigrants | 100.0 /100 | #66 | Exceptional 40.1% |
| Canadians | 100.0 /100 | #67 | Exceptional 40.1% |
| Italians | 99.9 /100 | #68 | Exceptional 40.1% |
| Potawatomi | 99.9 /100 | #69 | Exceptional 40.0% |
| Portuguese | 99.9 /100 | #70 | Exceptional 40.0% |
| Serbians | 99.9 /100 | #71 | Exceptional 39.9% |
| Iroquois | 99.9 /100 | #72 | Exceptional 39.9% |
| Immigrants | Middle Africa | 99.9 /100 | #73 | Exceptional 39.9% |
| Hungarians | 99.9 /100 | #74 | Exceptional 39.8% |
| French American Indians | 99.9 /100 | #75 | Exceptional 39.8% |
| Malaysians | 99.9 /100 | #76 | Exceptional 39.7% |
| Immigrants | Portugal | 99.9 /100 | #77 | Exceptional 39.7% |
| Austrians | 99.8 /100 | #78 | Exceptional 39.5% |
| Marshallese | 99.8 /100 | #79 | Exceptional 39.5% |
| Immigrants | Iraq | 99.8 /100 | #80 | Exceptional 39.4% |
Demographics Similar to Immigrants from Western Europe by In Labor Force | Age 16-19
In terms of in labor force | age 16-19, the demographic groups most similar to Immigrants from Western Europe are Brazilian (37.5%, a difference of 0.030%), Japanese (37.5%, a difference of 0.050%), Paiute (37.5%, a difference of 0.050%), Pakistani (37.6%, a difference of 0.070%), and Sierra Leonean (37.6%, a difference of 0.10%).
| Demographics | Rating | Rank | In Labor Force | Age 16-19 |
| Immigrants | Moldova | 91.9 /100 | #139 | Exceptional 37.7% |
| Estonians | 91.7 /100 | #140 | Exceptional 37.7% |
| Syrians | 90.7 /100 | #141 | Exceptional 37.6% |
| Sierra Leoneans | 89.7 /100 | #142 | Excellent 37.6% |
| Pakistanis | 89.5 /100 | #143 | Excellent 37.6% |
| Japanese | 89.3 /100 | #144 | Excellent 37.5% |
| Paiute | 89.3 /100 | #145 | Excellent 37.5% |
| Immigrants | Western Europe | 88.9 /100 | #146 | Excellent 37.5% |
| Brazilians | 88.7 /100 | #147 | Excellent 37.5% |
| Romanians | 87.3 /100 | #148 | Excellent 37.5% |
| Native Hawaiians | 85.0 /100 | #149 | Excellent 37.4% |
| Tsimshian | 84.7 /100 | #150 | Excellent 37.4% |
| Immigrants | Poland | 84.4 /100 | #151 | Excellent 37.3% |
| Immigrants | Sierra Leone | 83.6 /100 | #152 | Excellent 37.3% |
| Arapaho | 81.8 /100 | #153 | Excellent 37.3% |