Immigrants from Sudan vs Northern European In Labor Force | Age 20-64
COMPARE
Immigrants from Sudan
Northern European
In Labor Force | Age 20-64
In Labor Force | Age 20-64 Comparison
Immigrants from Sudan
Northern Europeans
80.4%
IN LABOR FORCE | AGE 20-64
99.4/ 100
METRIC RATING
50th/ 347
METRIC RANK
79.5%
IN LABOR FORCE | AGE 20-64
34.5/ 100
METRIC RATING
186th/ 347
METRIC RANK
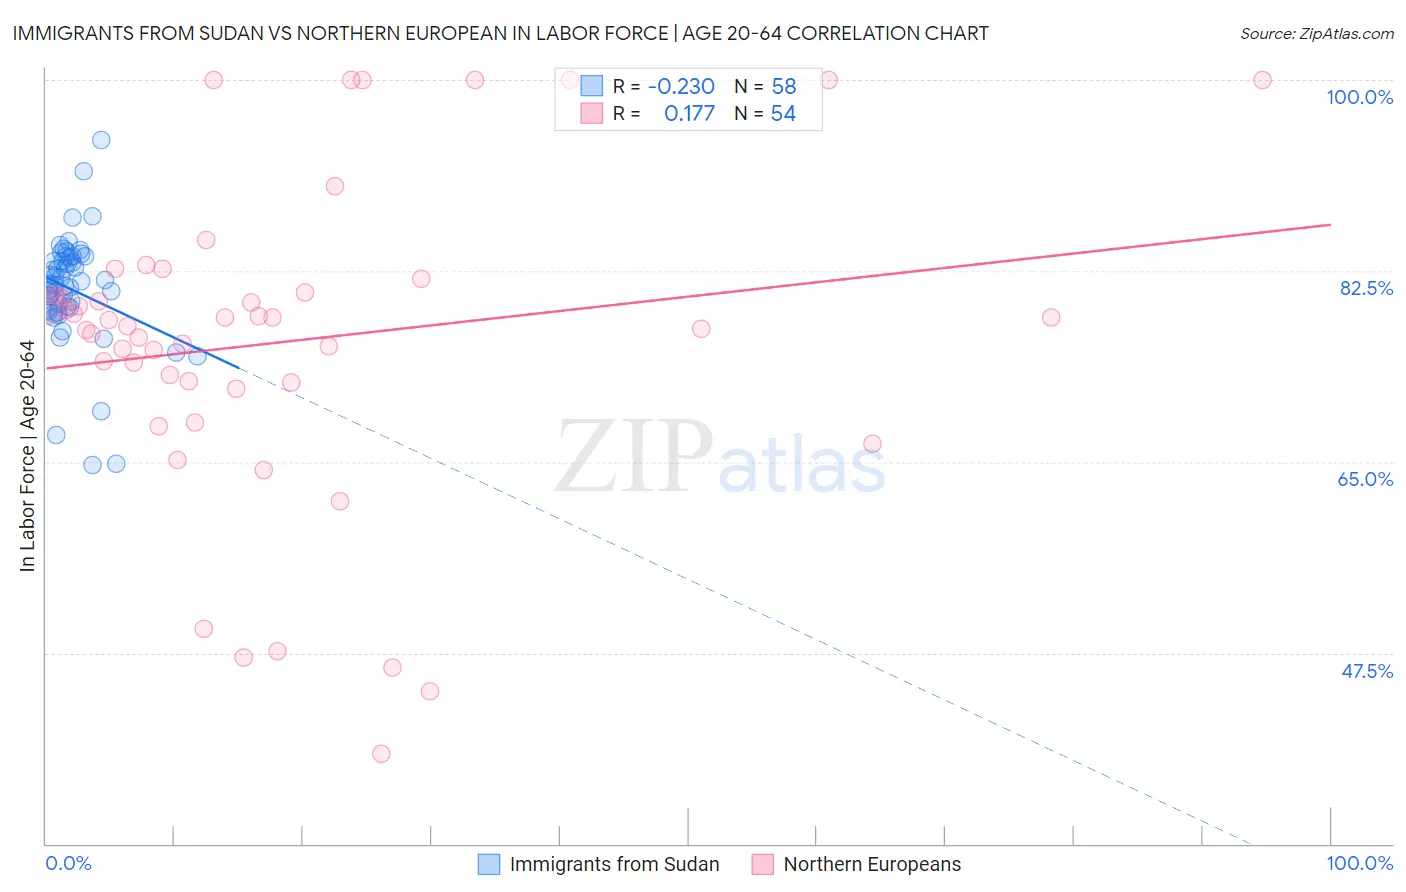
Immigrants from Sudan vs Northern European In Labor Force | Age 20-64 Correlation Chart
The statistical analysis conducted on geographies consisting of 118,972,362 people shows a weak negative correlation between the proportion of Immigrants from Sudan and labor force participation rate among population between the ages 20 and 64 in the United States with a correlation coefficient (R) of -0.230 and weighted average of 80.4%. Similarly, the statistical analysis conducted on geographies consisting of 406,102,116 people shows a poor positive correlation between the proportion of Northern Europeans and labor force participation rate among population between the ages 20 and 64 in the United States with a correlation coefficient (R) of 0.177 and weighted average of 79.5%, a difference of 1.1%.
In Labor Force | Age 20-64 Correlation Summary
| Measurement | Immigrants from Sudan | Northern European |
| Minimum | 64.7% | 38.3% |
| Maximum | 94.5% | 100.0% |
| Range | 29.8% | 61.7% |
| Mean | 80.8% | 76.0% |
| Median | 81.3% | 77.7% |
| Interquartile 25% (IQ1) | 79.1% | 72.3% |
| Interquartile 75% (IQ3) | 83.7% | 80.5% |
| Interquartile Range (IQR) | 4.6% | 8.2% |
| Standard Deviation (Sample) | 5.2% | 14.4% |
| Standard Deviation (Population) | 5.2% | 14.3% |
Similar Demographics by In Labor Force | Age 20-64
Demographics Similar to Immigrants from Sudan by In Labor Force | Age 20-64
In terms of in labor force | age 20-64, the demographic groups most similar to Immigrants from Sudan are Immigrants from Greece (80.4%, a difference of 0.020%), Immigrants from Sri Lanka (80.4%, a difference of 0.030%), Turkish (80.3%, a difference of 0.040%), Immigrants from Hong Kong (80.4%, a difference of 0.050%), and Immigrants from Peru (80.3%, a difference of 0.060%).
| Demographics | Rating | Rank | In Labor Force | Age 20-64 |
| Czechs | 99.7 /100 | #43 | Exceptional 80.5% |
| Immigrants | Middle Africa | 99.7 /100 | #44 | Exceptional 80.5% |
| Slovenes | 99.7 /100 | #45 | Exceptional 80.5% |
| Immigrants | Pakistan | 99.6 /100 | #46 | Exceptional 80.5% |
| Immigrants | Africa | 99.6 /100 | #47 | Exceptional 80.4% |
| Immigrants | Hong Kong | 99.5 /100 | #48 | Exceptional 80.4% |
| Immigrants | Greece | 99.4 /100 | #49 | Exceptional 80.4% |
| Immigrants | Sudan | 99.4 /100 | #50 | Exceptional 80.4% |
| Immigrants | Sri Lanka | 99.3 /100 | #51 | Exceptional 80.4% |
| Turks | 99.2 /100 | #52 | Exceptional 80.3% |
| Immigrants | Peru | 99.2 /100 | #53 | Exceptional 80.3% |
| Peruvians | 99.1 /100 | #54 | Exceptional 80.3% |
| Immigrants | Cabo Verde | 99.0 /100 | #55 | Exceptional 80.3% |
| Immigrants | Northern Africa | 99.0 /100 | #56 | Exceptional 80.3% |
| Afghans | 98.9 /100 | #57 | Exceptional 80.3% |
Demographics Similar to Northern Europeans by In Labor Force | Age 20-64
In terms of in labor force | age 20-64, the demographic groups most similar to Northern Europeans are Israeli (79.5%, a difference of 0.0%), Finnish (79.5%, a difference of 0.010%), Assyrian/Chaldean/Syriac (79.4%, a difference of 0.010%), Malaysian (79.5%, a difference of 0.020%), and Immigrants from Hungary (79.5%, a difference of 0.020%).
| Demographics | Rating | Rank | In Labor Force | Age 20-64 |
| Armenians | 41.4 /100 | #179 | Average 79.5% |
| Salvadorans | 41.0 /100 | #180 | Average 79.5% |
| Immigrants | Saudi Arabia | 37.7 /100 | #181 | Fair 79.5% |
| Malaysians | 37.1 /100 | #182 | Fair 79.5% |
| Immigrants | Hungary | 36.8 /100 | #183 | Fair 79.5% |
| Finns | 35.9 /100 | #184 | Fair 79.5% |
| Israelis | 34.7 /100 | #185 | Fair 79.5% |
| Northern Europeans | 34.5 /100 | #186 | Fair 79.5% |
| Assyrians/Chaldeans/Syriacs | 33.3 /100 | #187 | Fair 79.4% |
| Immigrants | Haiti | 32.1 /100 | #188 | Fair 79.4% |
| Immigrants | El Salvador | 30.9 /100 | #189 | Fair 79.4% |
| Immigrants | Syria | 30.8 /100 | #190 | Fair 79.4% |
| Swiss | 28.9 /100 | #191 | Fair 79.4% |
| Immigrants | Denmark | 26.9 /100 | #192 | Fair 79.4% |
| Indonesians | 26.1 /100 | #193 | Fair 79.4% |