German Russian vs Immigrants from Jordan In Labor Force | Age 20-24
COMPARE
German Russian
Immigrants from Jordan
In Labor Force | Age 20-24
In Labor Force | Age 20-24 Comparison
German Russians
Immigrants from Jordan
77.5%
IN LABOR FORCE | AGE 20-24
100.0/ 100
METRIC RATING
34th/ 347
METRIC RANK
75.6%
IN LABOR FORCE | AGE 20-24
88.5/ 100
METRIC RATING
131st/ 347
METRIC RANK
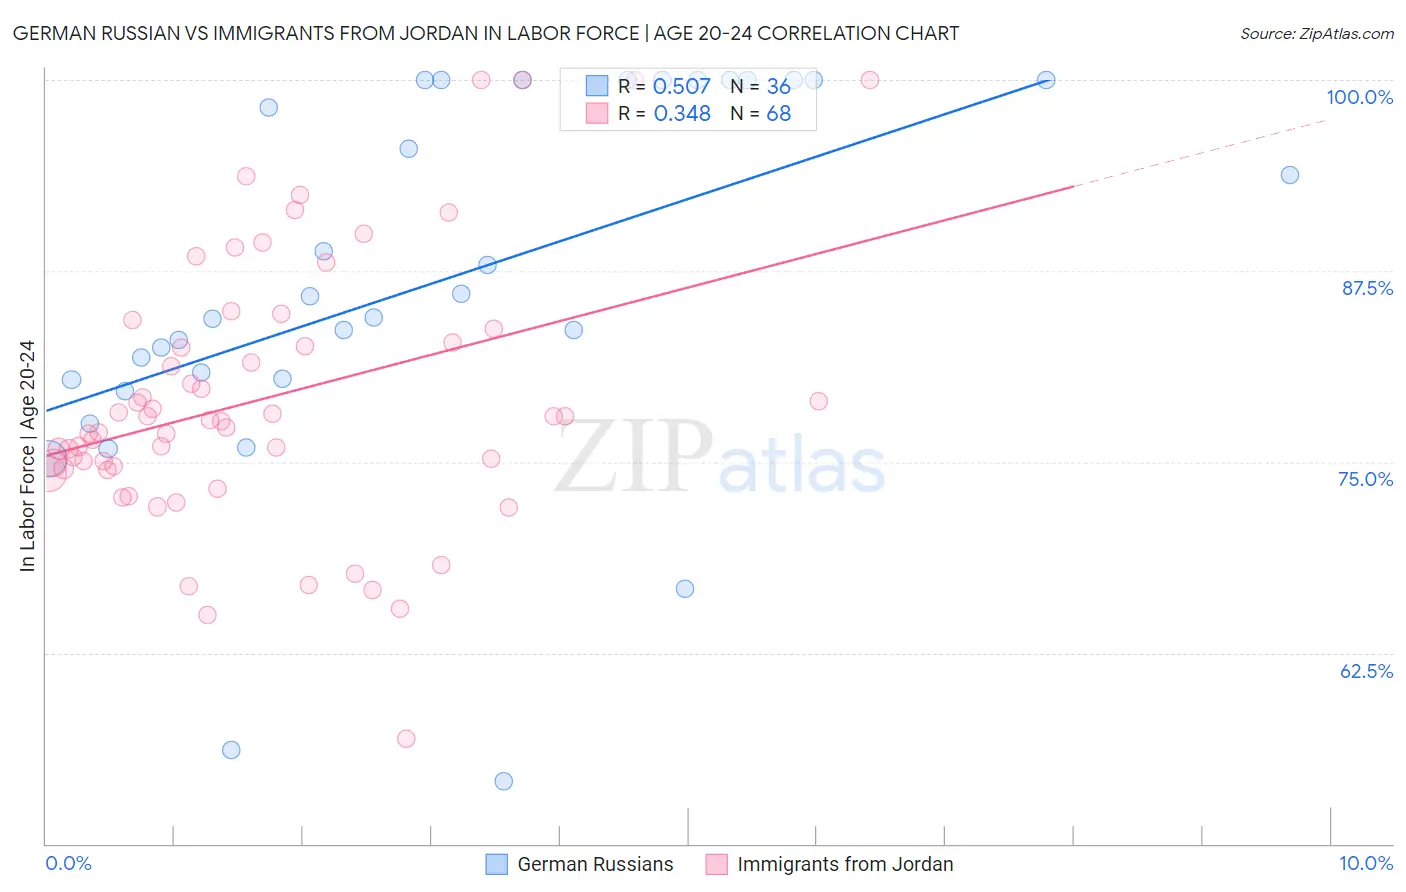
German Russian vs Immigrants from Jordan In Labor Force | Age 20-24 Correlation Chart
The statistical analysis conducted on geographies consisting of 96,452,832 people shows a substantial positive correlation between the proportion of German Russians and labor force participation rate among population between the ages 20 and 24 in the United States with a correlation coefficient (R) of 0.507 and weighted average of 77.5%. Similarly, the statistical analysis conducted on geographies consisting of 181,268,030 people shows a mild positive correlation between the proportion of Immigrants from Jordan and labor force participation rate among population between the ages 20 and 24 in the United States with a correlation coefficient (R) of 0.348 and weighted average of 75.6%, a difference of 2.5%.
In Labor Force | Age 20-24 Correlation Summary
| Measurement | German Russian | Immigrants from Jordan |
| Minimum | 54.1% | 56.9% |
| Maximum | 100.0% | 100.0% |
| Range | 45.9% | 43.1% |
| Mean | 86.7% | 79.1% |
| Median | 85.2% | 77.7% |
| Interquartile 25% (IQ1) | 80.4% | 74.7% |
| Interquartile 75% (IQ3) | 100.0% | 83.3% |
| Interquartile Range (IQR) | 19.6% | 8.6% |
| Standard Deviation (Sample) | 12.3% | 8.8% |
| Standard Deviation (Population) | 12.1% | 8.7% |
Similar Demographics by In Labor Force | Age 20-24
Demographics Similar to German Russians by In Labor Force | Age 20-24
In terms of in labor force | age 20-24, the demographic groups most similar to German Russians are Immigrants from Ethiopia (77.5%, a difference of 0.010%), Immigrants from Eastern Africa (77.5%, a difference of 0.010%), Welsh (77.5%, a difference of 0.030%), English (77.6%, a difference of 0.050%), and Czechoslovakian (77.5%, a difference of 0.050%).
| Demographics | Rating | Rank | In Labor Force | Age 20-24 |
| Immigrants | Micronesia | 100.0 /100 | #27 | Exceptional 77.8% |
| Belgians | 100.0 /100 | #28 | Exceptional 77.8% |
| Slovaks | 100.0 /100 | #29 | Exceptional 77.7% |
| Swiss | 100.0 /100 | #30 | Exceptional 77.7% |
| Poles | 100.0 /100 | #31 | Exceptional 77.6% |
| English | 100.0 /100 | #32 | Exceptional 77.6% |
| Immigrants | Ethiopia | 100.0 /100 | #33 | Exceptional 77.5% |
| German Russians | 100.0 /100 | #34 | Exceptional 77.5% |
| Immigrants | Eastern Africa | 100.0 /100 | #35 | Exceptional 77.5% |
| Welsh | 100.0 /100 | #36 | Exceptional 77.5% |
| Czechoslovakians | 100.0 /100 | #37 | Exceptional 77.5% |
| Marshallese | 100.0 /100 | #38 | Exceptional 77.4% |
| Irish | 100.0 /100 | #39 | Exceptional 77.4% |
| Scottish | 100.0 /100 | #40 | Exceptional 77.4% |
| Immigrants | Congo | 100.0 /100 | #41 | Exceptional 77.4% |
Demographics Similar to Immigrants from Jordan by In Labor Force | Age 20-24
In terms of in labor force | age 20-24, the demographic groups most similar to Immigrants from Jordan are Palestinian (75.6%, a difference of 0.0%), Immigrants from Austria (75.6%, a difference of 0.010%), Zimbabwean (75.6%, a difference of 0.010%), Iroquois (75.6%, a difference of 0.020%), and Immigrants from Afghanistan (75.6%, a difference of 0.030%).
| Demographics | Rating | Rank | In Labor Force | Age 20-24 |
| Immigrants | Sierra Leone | 93.8 /100 | #124 | Exceptional 75.8% |
| Immigrants | Scotland | 93.7 /100 | #125 | Exceptional 75.8% |
| Brazilians | 93.0 /100 | #126 | Exceptional 75.8% |
| Sub-Saharan Africans | 90.9 /100 | #127 | Exceptional 75.7% |
| Immigrants | Afghanistan | 89.4 /100 | #128 | Excellent 75.6% |
| Iroquois | 89.1 /100 | #129 | Excellent 75.6% |
| Immigrants | Austria | 88.8 /100 | #130 | Excellent 75.6% |
| Immigrants | Jordan | 88.5 /100 | #131 | Excellent 75.6% |
| Palestinians | 88.4 /100 | #132 | Excellent 75.6% |
| Zimbabweans | 88.2 /100 | #133 | Excellent 75.6% |
| Estonians | 87.1 /100 | #134 | Excellent 75.6% |
| Yaqui | 85.5 /100 | #135 | Excellent 75.5% |
| Immigrants | Brazil | 84.8 /100 | #136 | Excellent 75.5% |
| Jordanians | 84.8 /100 | #137 | Excellent 75.5% |
| Australians | 84.8 /100 | #138 | Excellent 75.5% |