Immigrants from Kazakhstan vs Immigrants from Jordan In Labor Force | Age 20-24
COMPARE
Immigrants from Kazakhstan
Immigrants from Jordan
In Labor Force | Age 20-24
In Labor Force | Age 20-24 Comparison
Immigrants from Kazakhstan
Immigrants from Jordan
73.8%
IN LABOR FORCE | AGE 20-24
1.1/ 100
METRIC RATING
252nd/ 347
METRIC RANK
75.6%
IN LABOR FORCE | AGE 20-24
88.5/ 100
METRIC RATING
131st/ 347
METRIC RANK
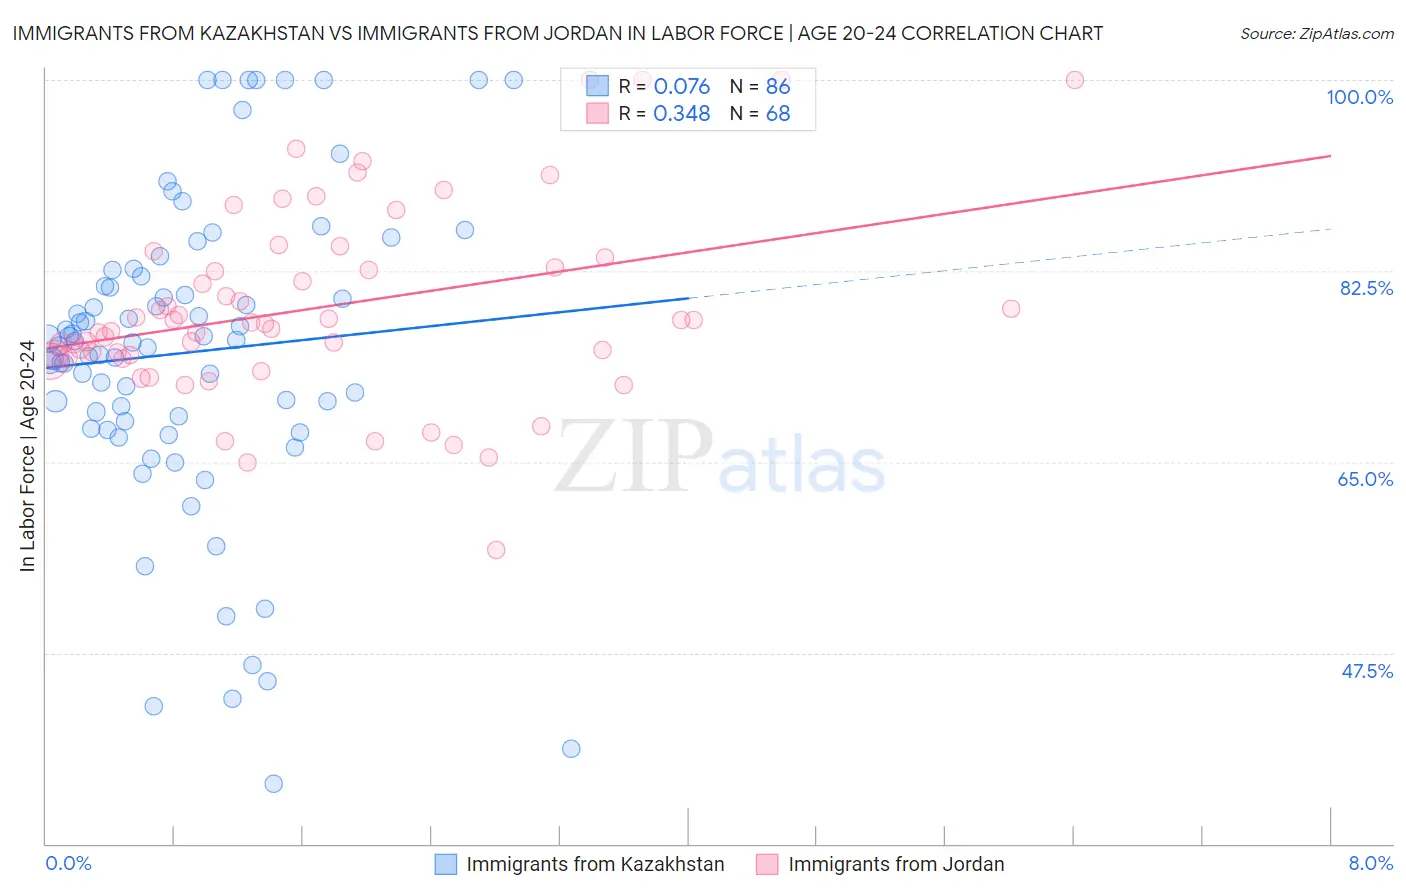
Immigrants from Kazakhstan vs Immigrants from Jordan In Labor Force | Age 20-24 Correlation Chart
The statistical analysis conducted on geographies consisting of 124,438,220 people shows a slight positive correlation between the proportion of Immigrants from Kazakhstan and labor force participation rate among population between the ages 20 and 24 in the United States with a correlation coefficient (R) of 0.076 and weighted average of 73.8%. Similarly, the statistical analysis conducted on geographies consisting of 181,268,030 people shows a mild positive correlation between the proportion of Immigrants from Jordan and labor force participation rate among population between the ages 20 and 24 in the United States with a correlation coefficient (R) of 0.348 and weighted average of 75.6%, a difference of 2.4%.
In Labor Force | Age 20-24 Correlation Summary
| Measurement | Immigrants from Kazakhstan | Immigrants from Jordan |
| Minimum | 35.5% | 56.9% |
| Maximum | 100.0% | 100.0% |
| Range | 64.5% | 43.1% |
| Mean | 75.0% | 79.1% |
| Median | 76.0% | 77.7% |
| Interquartile 25% (IQ1) | 68.8% | 74.7% |
| Interquartile 75% (IQ3) | 82.0% | 83.3% |
| Interquartile Range (IQR) | 13.2% | 8.6% |
| Standard Deviation (Sample) | 14.3% | 8.8% |
| Standard Deviation (Population) | 14.2% | 8.7% |
Similar Demographics by In Labor Force | Age 20-24
Demographics Similar to Immigrants from Kazakhstan by In Labor Force | Age 20-24
In terms of in labor force | age 20-24, the demographic groups most similar to Immigrants from Kazakhstan are Immigrants from Egypt (73.8%, a difference of 0.020%), Black/African American (73.9%, a difference of 0.040%), Immigrants from Belgium (73.9%, a difference of 0.040%), Arapaho (73.8%, a difference of 0.040%), and Ute (73.8%, a difference of 0.050%).
| Demographics | Rating | Rank | In Labor Force | Age 20-24 |
| Turks | 1.8 /100 | #245 | Tragic 73.9% |
| Immigrants | Panama | 1.6 /100 | #246 | Tragic 73.9% |
| Colville | 1.5 /100 | #247 | Tragic 73.9% |
| Immigrants | Saudi Arabia | 1.5 /100 | #248 | Tragic 73.9% |
| Blacks/African Americans | 1.3 /100 | #249 | Tragic 73.9% |
| Immigrants | Belgium | 1.3 /100 | #250 | Tragic 73.9% |
| Immigrants | Egypt | 1.2 /100 | #251 | Tragic 73.8% |
| Immigrants | Kazakhstan | 1.1 /100 | #252 | Tragic 73.8% |
| Arapaho | 1.0 /100 | #253 | Tragic 73.8% |
| Ute | 1.0 /100 | #254 | Tragic 73.8% |
| Immigrants | Pakistan | 0.9 /100 | #255 | Tragic 73.8% |
| Spanish American Indians | 0.8 /100 | #256 | Tragic 73.7% |
| Paraguayans | 0.8 /100 | #257 | Tragic 73.7% |
| Egyptians | 0.7 /100 | #258 | Tragic 73.7% |
| Dutch West Indians | 0.7 /100 | #259 | Tragic 73.7% |
Demographics Similar to Immigrants from Jordan by In Labor Force | Age 20-24
In terms of in labor force | age 20-24, the demographic groups most similar to Immigrants from Jordan are Palestinian (75.6%, a difference of 0.0%), Immigrants from Austria (75.6%, a difference of 0.010%), Zimbabwean (75.6%, a difference of 0.010%), Iroquois (75.6%, a difference of 0.020%), and Immigrants from Afghanistan (75.6%, a difference of 0.030%).
| Demographics | Rating | Rank | In Labor Force | Age 20-24 |
| Immigrants | Sierra Leone | 93.8 /100 | #124 | Exceptional 75.8% |
| Immigrants | Scotland | 93.7 /100 | #125 | Exceptional 75.8% |
| Brazilians | 93.0 /100 | #126 | Exceptional 75.8% |
| Sub-Saharan Africans | 90.9 /100 | #127 | Exceptional 75.7% |
| Immigrants | Afghanistan | 89.4 /100 | #128 | Excellent 75.6% |
| Iroquois | 89.1 /100 | #129 | Excellent 75.6% |
| Immigrants | Austria | 88.8 /100 | #130 | Excellent 75.6% |
| Immigrants | Jordan | 88.5 /100 | #131 | Excellent 75.6% |
| Palestinians | 88.4 /100 | #132 | Excellent 75.6% |
| Zimbabweans | 88.2 /100 | #133 | Excellent 75.6% |
| Estonians | 87.1 /100 | #134 | Excellent 75.6% |
| Yaqui | 85.5 /100 | #135 | Excellent 75.5% |
| Immigrants | Brazil | 84.8 /100 | #136 | Excellent 75.5% |
| Jordanians | 84.8 /100 | #137 | Excellent 75.5% |
| Australians | 84.8 /100 | #138 | Excellent 75.5% |