Immigrants from Sweden vs Immigrants from Jordan In Labor Force | Age 20-24
COMPARE
Immigrants from Sweden
Immigrants from Jordan
In Labor Force | Age 20-24
In Labor Force | Age 20-24 Comparison
Immigrants from Sweden
Immigrants from Jordan
74.2%
IN LABOR FORCE | AGE 20-24
4.6/ 100
METRIC RATING
229th/ 347
METRIC RANK
75.6%
IN LABOR FORCE | AGE 20-24
88.5/ 100
METRIC RATING
131st/ 347
METRIC RANK
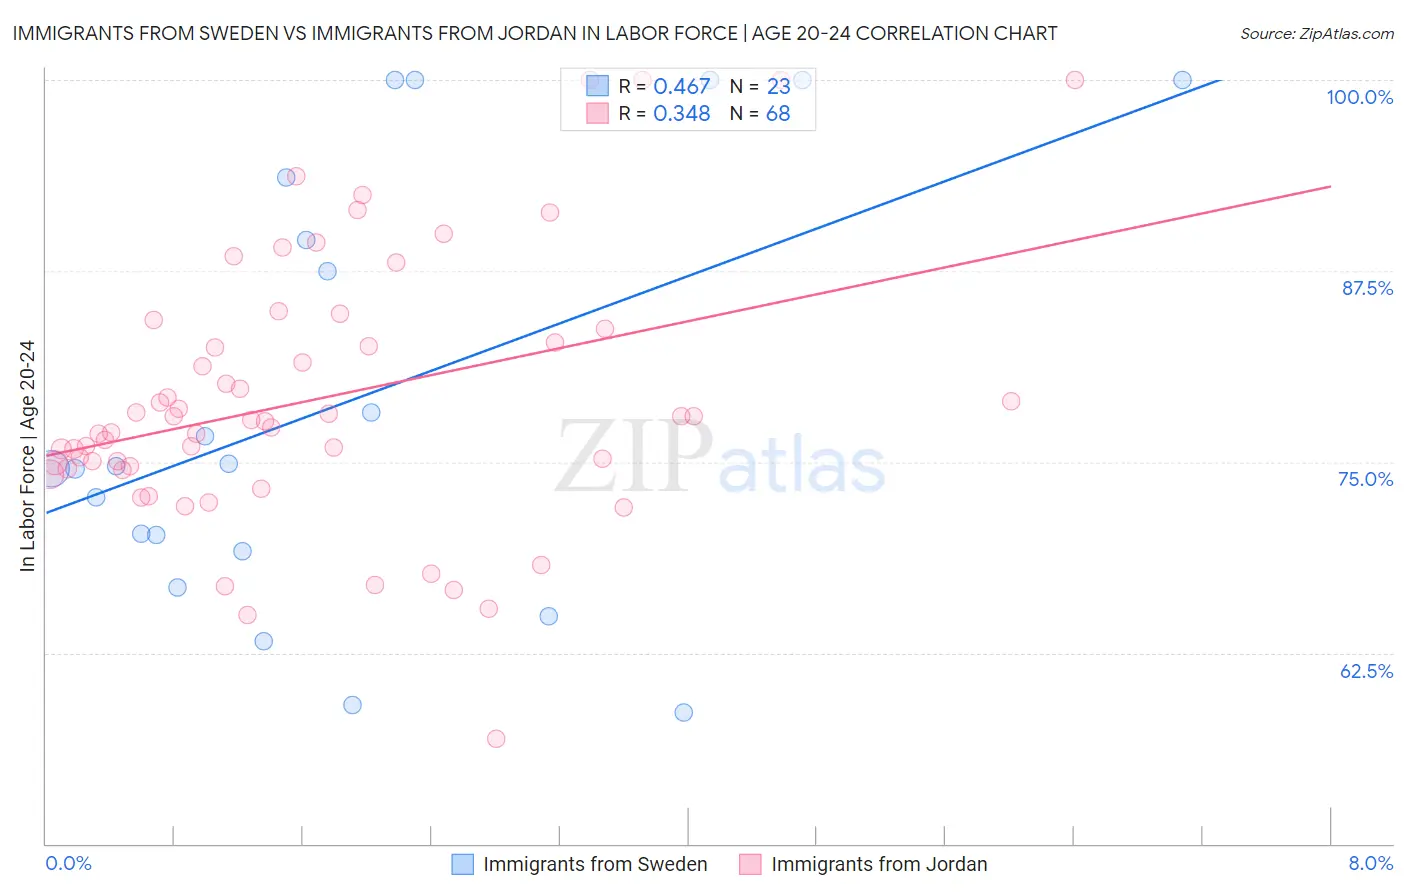
Immigrants from Sweden vs Immigrants from Jordan In Labor Force | Age 20-24 Correlation Chart
The statistical analysis conducted on geographies consisting of 164,691,562 people shows a moderate positive correlation between the proportion of Immigrants from Sweden and labor force participation rate among population between the ages 20 and 24 in the United States with a correlation coefficient (R) of 0.467 and weighted average of 74.2%. Similarly, the statistical analysis conducted on geographies consisting of 181,268,030 people shows a mild positive correlation between the proportion of Immigrants from Jordan and labor force participation rate among population between the ages 20 and 24 in the United States with a correlation coefficient (R) of 0.348 and weighted average of 75.6%, a difference of 1.9%.
In Labor Force | Age 20-24 Correlation Summary
| Measurement | Immigrants from Sweden | Immigrants from Jordan |
| Minimum | 58.6% | 56.9% |
| Maximum | 100.0% | 100.0% |
| Range | 41.4% | 43.1% |
| Mean | 79.1% | 79.1% |
| Median | 74.7% | 77.7% |
| Interquartile 25% (IQ1) | 69.2% | 74.7% |
| Interquartile 75% (IQ3) | 93.6% | 83.3% |
| Interquartile Range (IQR) | 24.4% | 8.6% |
| Standard Deviation (Sample) | 14.1% | 8.8% |
| Standard Deviation (Population) | 13.8% | 8.7% |
Similar Demographics by In Labor Force | Age 20-24
Demographics Similar to Immigrants from Sweden by In Labor Force | Age 20-24
In terms of in labor force | age 20-24, the demographic groups most similar to Immigrants from Sweden are Immigrants from Albania (74.2%, a difference of 0.030%), Immigrants from Ukraine (74.2%, a difference of 0.040%), Immigrants from Greece (74.2%, a difference of 0.040%), Immigrants from Switzerland (74.2%, a difference of 0.050%), and Immigrants from Fiji (74.3%, a difference of 0.090%).
| Demographics | Rating | Rank | In Labor Force | Age 20-24 |
| Immigrants | India | 9.9 /100 | #222 | Tragic 74.4% |
| Hispanics or Latinos | 7.9 /100 | #223 | Tragic 74.4% |
| Seminole | 6.9 /100 | #224 | Tragic 74.3% |
| Ghanaians | 6.2 /100 | #225 | Tragic 74.3% |
| Immigrants | Fiji | 5.9 /100 | #226 | Tragic 74.3% |
| Immigrants | Ireland | 5.8 /100 | #227 | Tragic 74.3% |
| Immigrants | Ukraine | 5.1 /100 | #228 | Tragic 74.2% |
| Immigrants | Sweden | 4.6 /100 | #229 | Tragic 74.2% |
| Immigrants | Albania | 4.3 /100 | #230 | Tragic 74.2% |
| Immigrants | Greece | 4.1 /100 | #231 | Tragic 74.2% |
| Immigrants | Switzerland | 4.1 /100 | #232 | Tragic 74.2% |
| Immigrants | Chile | 3.7 /100 | #233 | Tragic 74.1% |
| Immigrants | Immigrants | 3.6 /100 | #234 | Tragic 74.1% |
| Laotians | 3.5 /100 | #235 | Tragic 74.1% |
| Immigrants | France | 3.3 /100 | #236 | Tragic 74.1% |
Demographics Similar to Immigrants from Jordan by In Labor Force | Age 20-24
In terms of in labor force | age 20-24, the demographic groups most similar to Immigrants from Jordan are Palestinian (75.6%, a difference of 0.0%), Immigrants from Austria (75.6%, a difference of 0.010%), Zimbabwean (75.6%, a difference of 0.010%), Iroquois (75.6%, a difference of 0.020%), and Immigrants from Afghanistan (75.6%, a difference of 0.030%).
| Demographics | Rating | Rank | In Labor Force | Age 20-24 |
| Immigrants | Sierra Leone | 93.8 /100 | #124 | Exceptional 75.8% |
| Immigrants | Scotland | 93.7 /100 | #125 | Exceptional 75.8% |
| Brazilians | 93.0 /100 | #126 | Exceptional 75.8% |
| Sub-Saharan Africans | 90.9 /100 | #127 | Exceptional 75.7% |
| Immigrants | Afghanistan | 89.4 /100 | #128 | Excellent 75.6% |
| Iroquois | 89.1 /100 | #129 | Excellent 75.6% |
| Immigrants | Austria | 88.8 /100 | #130 | Excellent 75.6% |
| Immigrants | Jordan | 88.5 /100 | #131 | Excellent 75.6% |
| Palestinians | 88.4 /100 | #132 | Excellent 75.6% |
| Zimbabweans | 88.2 /100 | #133 | Excellent 75.6% |
| Estonians | 87.1 /100 | #134 | Excellent 75.6% |
| Yaqui | 85.5 /100 | #135 | Excellent 75.5% |
| Immigrants | Brazil | 84.8 /100 | #136 | Excellent 75.5% |
| Jordanians | 84.8 /100 | #137 | Excellent 75.5% |
| Australians | 84.8 /100 | #138 | Excellent 75.5% |