Immigrants from Spain vs Asian In Labor Force | Age 16-19
COMPARE
Immigrants from Spain
Asian
In Labor Force | Age 16-19
In Labor Force | Age 16-19 Comparison
Immigrants from Spain
Asians
33.7%
IN LABOR FORCE | AGE 16-19
0.2/ 100
METRIC RATING
284th/ 347
METRIC RANK
34.1%
IN LABOR FORCE | AGE 16-19
0.4/ 100
METRIC RATING
272nd/ 347
METRIC RANK
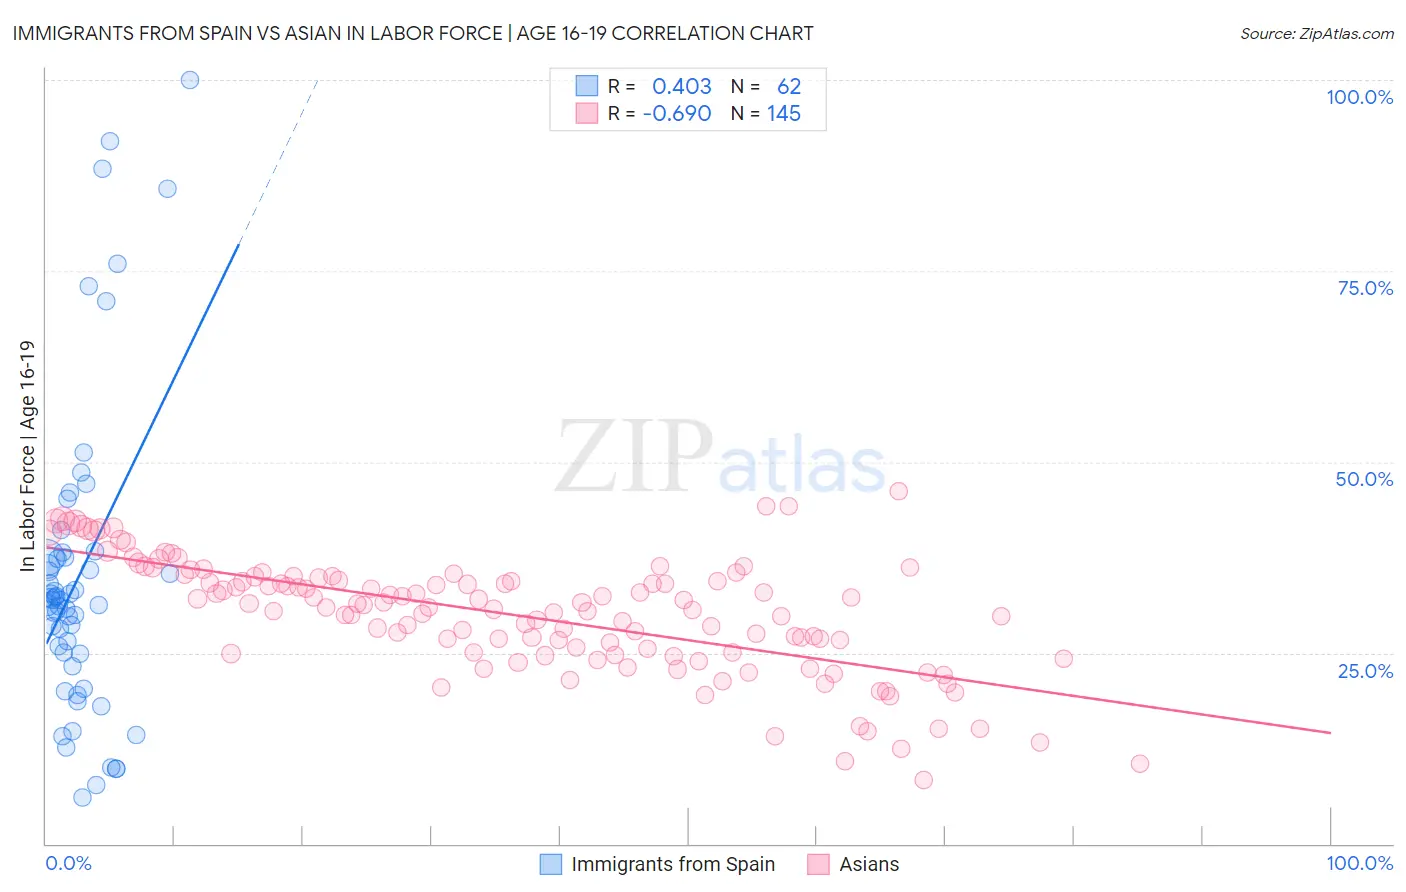
Immigrants from Spain vs Asian In Labor Force | Age 16-19 Correlation Chart
The statistical analysis conducted on geographies consisting of 239,401,400 people shows a moderate positive correlation between the proportion of Immigrants from Spain and labor force participation rate among population between the ages 16 and 19 in the United States with a correlation coefficient (R) of 0.403 and weighted average of 33.7%. Similarly, the statistical analysis conducted on geographies consisting of 548,440,716 people shows a significant negative correlation between the proportion of Asians and labor force participation rate among population between the ages 16 and 19 in the United States with a correlation coefficient (R) of -0.690 and weighted average of 34.1%, a difference of 1.1%.
In Labor Force | Age 16-19 Correlation Summary
| Measurement | Immigrants from Spain | Asian |
| Minimum | 6.1% | 8.3% |
| Maximum | 100.0% | 46.1% |
| Range | 93.9% | 37.8% |
| Mean | 35.1% | 29.9% |
| Median | 31.9% | 30.9% |
| Interquartile 25% (IQ1) | 24.8% | 25.0% |
| Interquartile 75% (IQ3) | 37.5% | 34.9% |
| Interquartile Range (IQR) | 12.7% | 9.9% |
| Standard Deviation (Sample) | 20.5% | 7.6% |
| Standard Deviation (Population) | 20.3% | 7.6% |
Demographics Similar to Immigrants from Spain and Asians by In Labor Force | Age 16-19
In terms of in labor force | age 16-19, the demographic groups most similar to Immigrants from Spain are Immigrants from Venezuela (33.7%, a difference of 0.060%), U.S. Virgin Islander (33.6%, a difference of 0.19%), South American (33.6%, a difference of 0.27%), Immigrants from Korea (33.8%, a difference of 0.41%), and Cypriot (33.8%, a difference of 0.42%). Similarly, the demographic groups most similar to Asians are Immigrants from Russia (34.1%, a difference of 0.030%), Central American Indian (34.1%, a difference of 0.030%), Pima (34.1%, a difference of 0.070%), Immigrants from Asia (34.1%, a difference of 0.16%), and Immigrants from Panama (34.0%, a difference of 0.22%).
| Demographics | Rating | Rank | In Labor Force | Age 16-19 |
| Immigrants | Asia | 0.5 /100 | #268 | Tragic 34.1% |
| Pima | 0.5 /100 | #269 | Tragic 34.1% |
| Immigrants | Russia | 0.4 /100 | #270 | Tragic 34.1% |
| Central American Indians | 0.4 /100 | #271 | Tragic 34.1% |
| Asians | 0.4 /100 | #272 | Tragic 34.1% |
| Immigrants | Panama | 0.4 /100 | #273 | Tragic 34.0% |
| Venezuelans | 0.3 /100 | #274 | Tragic 34.0% |
| Immigrants | Fiji | 0.3 /100 | #275 | Tragic 33.9% |
| Immigrants | Latin America | 0.3 /100 | #276 | Tragic 33.9% |
| Menominee | 0.3 /100 | #277 | Tragic 33.9% |
| Colombians | 0.3 /100 | #278 | Tragic 33.8% |
| Paraguayans | 0.3 /100 | #279 | Tragic 33.8% |
| Taiwanese | 0.3 /100 | #280 | Tragic 33.8% |
| Cypriots | 0.3 /100 | #281 | Tragic 33.8% |
| Immigrants | Korea | 0.3 /100 | #282 | Tragic 33.8% |
| Immigrants | Venezuela | 0.2 /100 | #283 | Tragic 33.7% |
| Immigrants | Spain | 0.2 /100 | #284 | Tragic 33.7% |
| U.S. Virgin Islanders | 0.2 /100 | #285 | Tragic 33.6% |
| South Americans | 0.2 /100 | #286 | Tragic 33.6% |
| Nepalese | 0.1 /100 | #287 | Tragic 33.5% |
| Immigrants | Indonesia | 0.1 /100 | #288 | Tragic 33.5% |