Immigrants from Southern Europe vs Immigrants from Cuba In Labor Force | Age > 16
COMPARE
Immigrants from Southern Europe
Immigrants from Cuba
In Labor Force | Age > 16
In Labor Force | Age > 16 Comparison
Immigrants from Southern Europe
Immigrants from Cuba
65.0%
IN LABOR FORCE | AGE > 16
31.3/ 100
METRIC RATING
194th/ 347
METRIC RANK
64.1%
IN LABOR FORCE | AGE > 16
0.3/ 100
METRIC RATING
274th/ 347
METRIC RANK
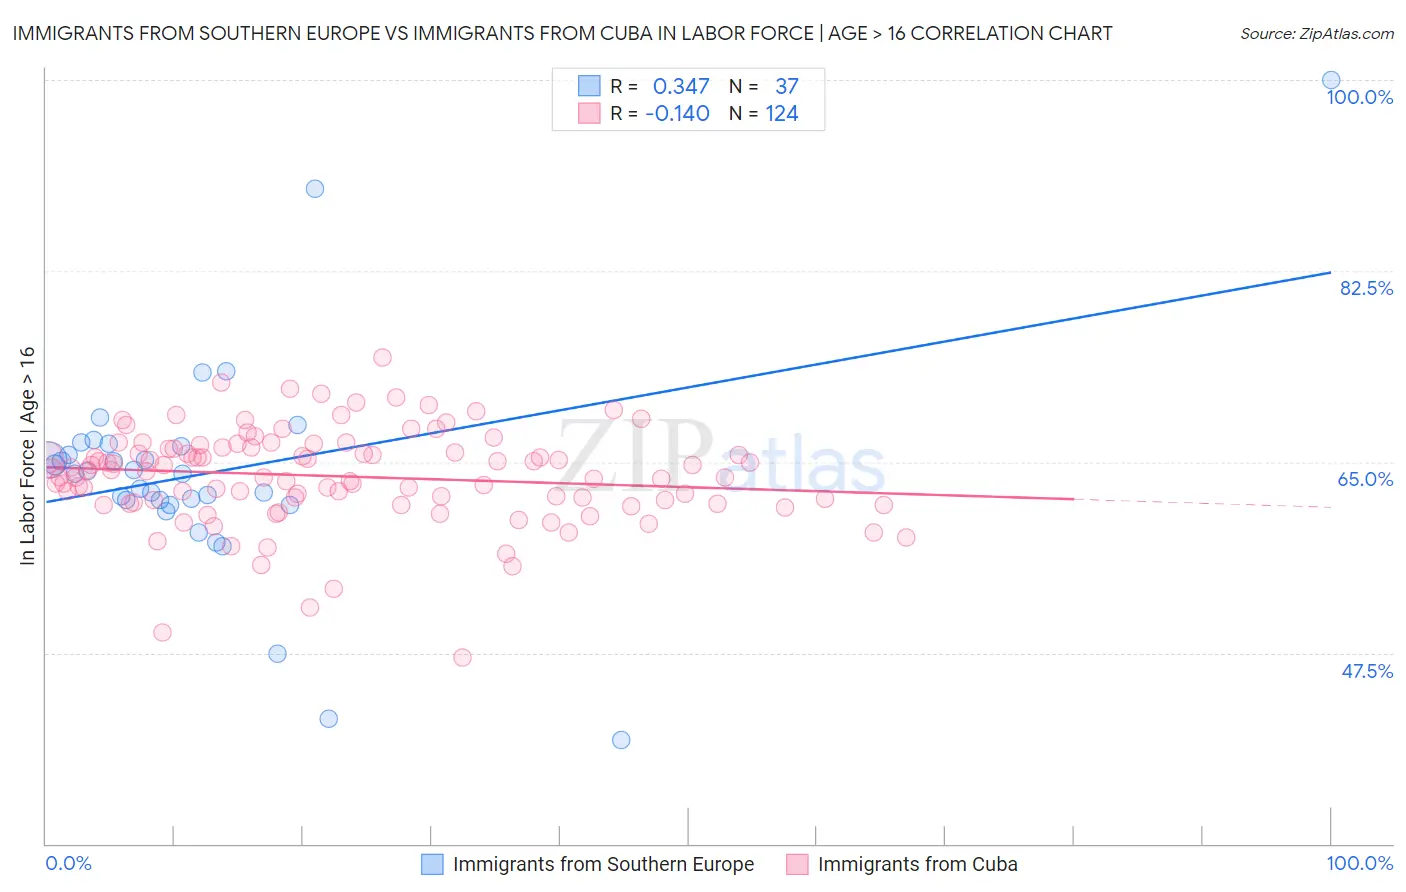
Immigrants from Southern Europe vs Immigrants from Cuba In Labor Force | Age > 16 Correlation Chart
The statistical analysis conducted on geographies consisting of 402,799,344 people shows a mild positive correlation between the proportion of Immigrants from Southern Europe and labor force participation rate among population ages 16 and over in the United States with a correlation coefficient (R) of 0.347 and weighted average of 65.0%. Similarly, the statistical analysis conducted on geographies consisting of 326,010,342 people shows a poor negative correlation between the proportion of Immigrants from Cuba and labor force participation rate among population ages 16 and over in the United States with a correlation coefficient (R) of -0.140 and weighted average of 64.1%, a difference of 1.4%.
In Labor Force | Age > 16 Correlation Summary
| Measurement | Immigrants from Southern Europe | Immigrants from Cuba |
| Minimum | 39.5% | 47.1% |
| Maximum | 100.0% | 74.6% |
| Range | 60.5% | 27.5% |
| Mean | 64.0% | 63.7% |
| Median | 63.9% | 64.2% |
| Interquartile 25% (IQ1) | 61.3% | 61.4% |
| Interquartile 75% (IQ3) | 66.6% | 66.3% |
| Interquartile Range (IQR) | 5.2% | 4.9% |
| Standard Deviation (Sample) | 10.3% | 4.4% |
| Standard Deviation (Population) | 10.1% | 4.4% |
Similar Demographics by In Labor Force | Age > 16
Demographics Similar to Immigrants from Southern Europe by In Labor Force | Age > 16
In terms of in labor force | age > 16, the demographic groups most similar to Immigrants from Southern Europe are Romanian (65.0%, a difference of 0.0%), Haitian (65.0%, a difference of 0.010%), Barbadian (65.0%, a difference of 0.030%), Scandinavian (65.0%, a difference of 0.030%), and Immigrants from Fiji (65.0%, a difference of 0.030%).
| Demographics | Rating | Rank | In Labor Force | Age > 16 |
| Immigrants | Croatia | 35.7 /100 | #187 | Fair 65.0% |
| Immigrants | Portugal | 34.8 /100 | #188 | Fair 65.0% |
| Immigrants | Greece | 34.3 /100 | #189 | Fair 65.0% |
| Barbadians | 33.9 /100 | #190 | Fair 65.0% |
| Scandinavians | 33.7 /100 | #191 | Fair 65.0% |
| Immigrants | Fiji | 33.7 /100 | #192 | Fair 65.0% |
| Immigrants | Europe | 33.6 /100 | #193 | Fair 65.0% |
| Immigrants | Southern Europe | 31.3 /100 | #194 | Fair 65.0% |
| Romanians | 31.1 /100 | #195 | Fair 65.0% |
| Haitians | 30.6 /100 | #196 | Fair 65.0% |
| Immigrants | Italy | 28.7 /100 | #197 | Fair 65.0% |
| Greeks | 26.1 /100 | #198 | Fair 64.9% |
| Mexican American Indians | 23.1 /100 | #199 | Fair 64.9% |
| Armenians | 20.2 /100 | #200 | Fair 64.9% |
| Ukrainians | 19.6 /100 | #201 | Poor 64.9% |
Demographics Similar to Immigrants from Cuba by In Labor Force | Age > 16
In terms of in labor force | age > 16, the demographic groups most similar to Immigrants from Cuba are Mexican (64.1%, a difference of 0.0%), French American Indian (64.1%, a difference of 0.0%), Native Hawaiian (64.1%, a difference of 0.020%), Hmong (64.1%, a difference of 0.020%), and Immigrants from Bahamas (64.0%, a difference of 0.030%).
| Demographics | Rating | Rank | In Labor Force | Age > 16 |
| Canadians | 0.5 /100 | #267 | Tragic 64.1% |
| Spaniards | 0.5 /100 | #268 | Tragic 64.1% |
| Irish | 0.4 /100 | #269 | Tragic 64.1% |
| Guyanese | 0.4 /100 | #270 | Tragic 64.1% |
| Dominicans | 0.4 /100 | #271 | Tragic 64.1% |
| Native Hawaiians | 0.3 /100 | #272 | Tragic 64.1% |
| Hmong | 0.3 /100 | #273 | Tragic 64.1% |
| Immigrants | Cuba | 0.3 /100 | #274 | Tragic 64.1% |
| Mexicans | 0.3 /100 | #275 | Tragic 64.1% |
| French American Indians | 0.3 /100 | #276 | Tragic 64.1% |
| Immigrants | Bahamas | 0.3 /100 | #277 | Tragic 64.0% |
| Assyrians/Chaldeans/Syriacs | 0.3 /100 | #278 | Tragic 64.0% |
| Welsh | 0.2 /100 | #279 | Tragic 64.0% |
| Immigrants | St. Vincent and the Grenadines | 0.2 /100 | #280 | Tragic 64.0% |
| French Canadians | 0.2 /100 | #281 | Tragic 64.0% |