Immigrants from Southern Europe vs Immigrants from Japan Unemployment Among Ages 25 to 29 years
COMPARE
Immigrants from Southern Europe
Immigrants from Japan
Unemployment Among Ages 25 to 29 years
Unemployment Among Ages 25 to 29 years Comparison
Immigrants from Southern Europe
Immigrants from Japan
6.8%
UNEMPLOYMENT AMONG AGES 25 TO 29 YEARS
24.6/ 100
METRIC RATING
198th/ 347
METRIC RANK
6.0%
UNEMPLOYMENT AMONG AGES 25 TO 29 YEARS
99.9/ 100
METRIC RATING
22nd/ 347
METRIC RANK
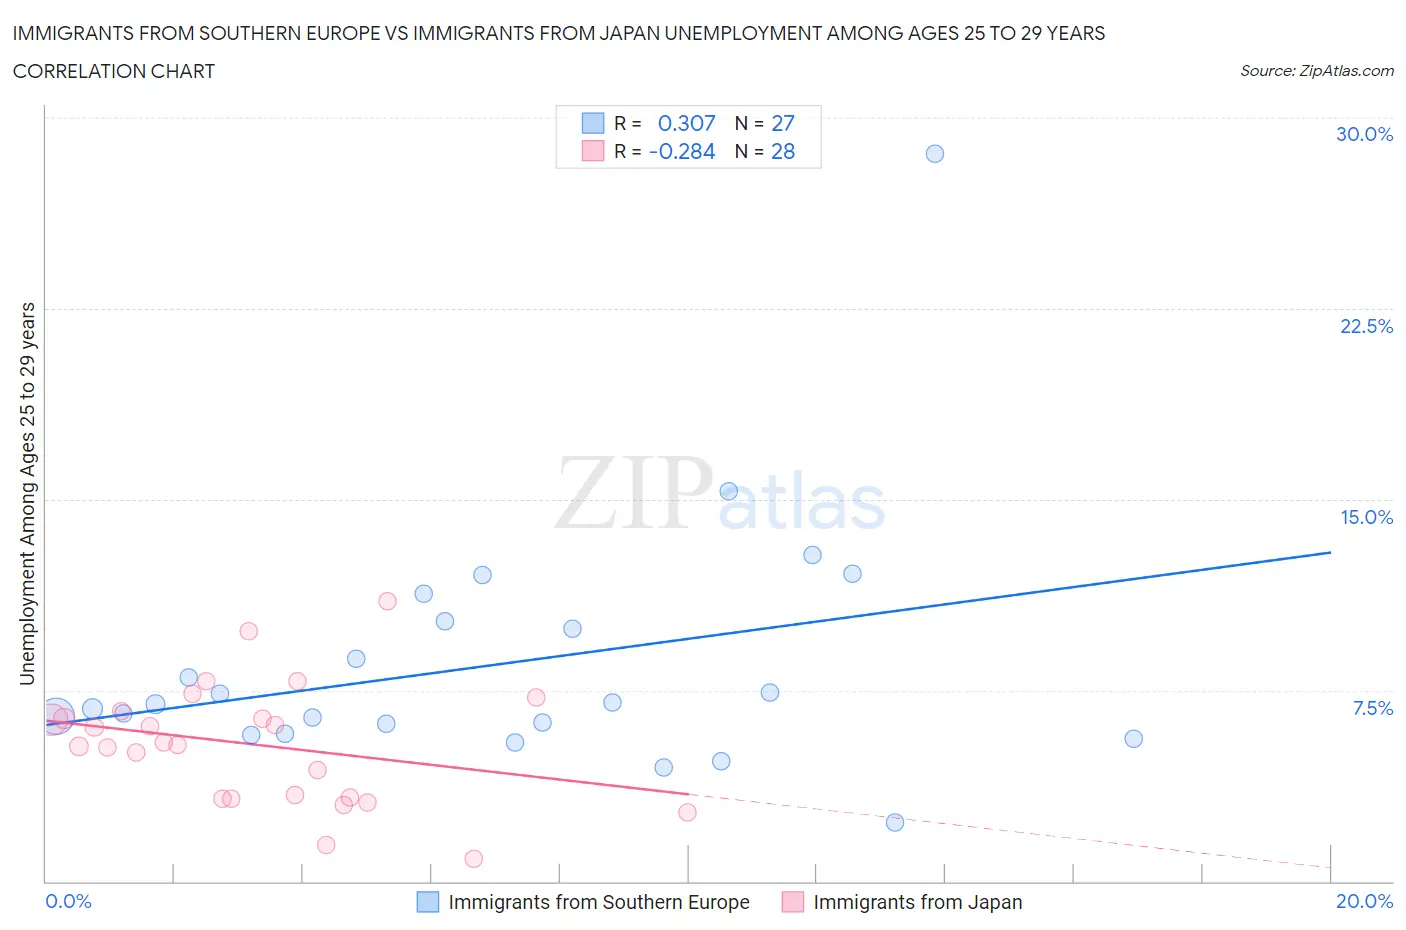
Immigrants from Southern Europe vs Immigrants from Japan Unemployment Among Ages 25 to 29 years Correlation Chart
The statistical analysis conducted on geographies consisting of 381,533,960 people shows a mild positive correlation between the proportion of Immigrants from Southern Europe and unemployment rate among population between the ages 25 and 29 in the United States with a correlation coefficient (R) of 0.307 and weighted average of 6.8%. Similarly, the statistical analysis conducted on geographies consisting of 327,117,798 people shows a weak negative correlation between the proportion of Immigrants from Japan and unemployment rate among population between the ages 25 and 29 in the United States with a correlation coefficient (R) of -0.284 and weighted average of 6.0%, a difference of 13.0%.
Unemployment Among Ages 25 to 29 years Correlation Summary
| Measurement | Immigrants from Southern Europe | Immigrants from Japan |
| Minimum | 2.3% | 0.90% |
| Maximum | 28.6% | 11.0% |
| Range | 26.3% | 10.1% |
| Mean | 8.5% | 5.4% |
| Median | 7.0% | 5.4% |
| Interquartile 25% (IQ1) | 5.8% | 3.3% |
| Interquartile 75% (IQ3) | 10.2% | 6.5% |
| Interquartile Range (IQR) | 4.4% | 3.3% |
| Standard Deviation (Sample) | 5.0% | 2.4% |
| Standard Deviation (Population) | 4.9% | 2.3% |
Similar Demographics by Unemployment Among Ages 25 to 29 years
Demographics Similar to Immigrants from Southern Europe by Unemployment Among Ages 25 to 29 years
In terms of unemployment among ages 25 to 29 years, the demographic groups most similar to Immigrants from Southern Europe are Guamanian/Chamorro (6.8%, a difference of 0.020%), South American Indian (6.8%, a difference of 0.10%), Italian (6.8%, a difference of 0.16%), Basque (6.8%, a difference of 0.17%), and Hungarian (6.8%, a difference of 0.18%).
| Demographics | Rating | Rank | Unemployment Among Ages 25 to 29 years |
| Chickasaw | 28.7 /100 | #191 | Fair 6.7% |
| Immigrants | Ukraine | 28.6 /100 | #192 | Fair 6.7% |
| Alsatians | 28.1 /100 | #193 | Fair 6.7% |
| Immigrants | Greece | 28.0 /100 | #194 | Fair 6.7% |
| Immigrants | Western Asia | 27.3 /100 | #195 | Fair 6.7% |
| Hungarians | 26.8 /100 | #196 | Fair 6.8% |
| Italians | 26.5 /100 | #197 | Fair 6.8% |
| Immigrants | Southern Europe | 24.6 /100 | #198 | Fair 6.8% |
| Guamanians/Chamorros | 24.3 /100 | #199 | Fair 6.8% |
| South American Indians | 23.3 /100 | #200 | Fair 6.8% |
| Basques | 22.5 /100 | #201 | Fair 6.8% |
| Immigrants | Argentina | 21.6 /100 | #202 | Fair 6.8% |
| Immigrants | Norway | 21.2 /100 | #203 | Fair 6.8% |
| Scotch-Irish | 20.0 /100 | #204 | Poor 6.8% |
| Immigrants | England | 19.8 /100 | #205 | Poor 6.8% |
Demographics Similar to Immigrants from Japan by Unemployment Among Ages 25 to 29 years
In terms of unemployment among ages 25 to 29 years, the demographic groups most similar to Immigrants from Japan are Immigrants from Venezuela (6.0%, a difference of 0.060%), Norwegian (6.0%, a difference of 0.11%), Immigrants from Ethiopia (6.0%, a difference of 0.27%), Immigrants from Eritrea (5.9%, a difference of 0.61%), and New Zealander (6.0%, a difference of 0.75%).
| Demographics | Rating | Rank | Unemployment Among Ages 25 to 29 years |
| Cubans | 99.9 /100 | #15 | Exceptional 5.9% |
| Immigrants | Bulgaria | 99.9 /100 | #16 | Exceptional 5.9% |
| Bolivians | 99.9 /100 | #17 | Exceptional 5.9% |
| Immigrants | Singapore | 99.9 /100 | #18 | Exceptional 5.9% |
| Thais | 99.9 /100 | #19 | Exceptional 5.9% |
| Immigrants | Eritrea | 99.9 /100 | #20 | Exceptional 5.9% |
| Immigrants | Ethiopia | 99.9 /100 | #21 | Exceptional 6.0% |
| Immigrants | Japan | 99.9 /100 | #22 | Exceptional 6.0% |
| Immigrants | Venezuela | 99.8 /100 | #23 | Exceptional 6.0% |
| Norwegians | 99.8 /100 | #24 | Exceptional 6.0% |
| New Zealanders | 99.8 /100 | #25 | Exceptional 6.0% |
| Immigrants | Eastern Africa | 99.8 /100 | #26 | Exceptional 6.0% |
| Immigrants | Zaire | 99.7 /100 | #27 | Exceptional 6.0% |
| Danes | 99.7 /100 | #28 | Exceptional 6.0% |
| Immigrants | South Central Asia | 99.7 /100 | #29 | Exceptional 6.1% |