Spaniard vs Nepalese In Labor Force | Age > 16
COMPARE
Spaniard
Nepalese
In Labor Force | Age > 16
In Labor Force | Age > 16 Comparison
Spaniards
Nepalese
64.1%
IN LABOR FORCE | AGE > 16
0.5/ 100
METRIC RATING
268th/ 347
METRIC RANK
63.8%
IN LABOR FORCE | AGE > 16
0.1/ 100
METRIC RATING
291st/ 347
METRIC RANK
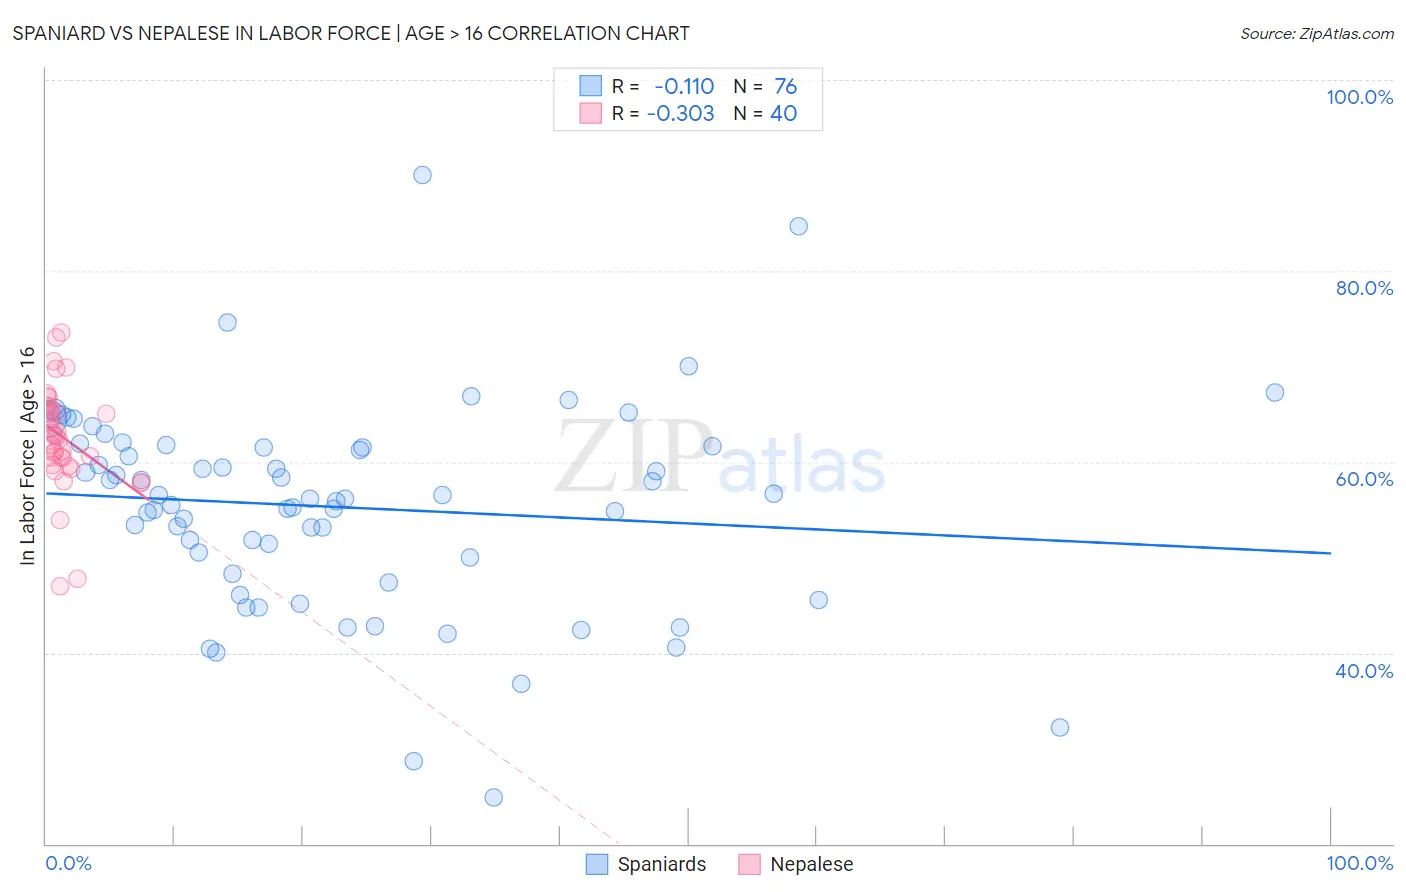
Spaniard vs Nepalese In Labor Force | Age > 16 Correlation Chart
The statistical analysis conducted on geographies consisting of 443,548,317 people shows a poor negative correlation between the proportion of Spaniards and labor force participation rate among population ages 16 and over in the United States with a correlation coefficient (R) of -0.110 and weighted average of 64.1%. Similarly, the statistical analysis conducted on geographies consisting of 24,521,755 people shows a mild negative correlation between the proportion of Nepalese and labor force participation rate among population ages 16 and over in the United States with a correlation coefficient (R) of -0.303 and weighted average of 63.8%, a difference of 0.53%.
In Labor Force | Age > 16 Correlation Summary
| Measurement | Spaniard | Nepalese |
| Minimum | 24.9% | 47.0% |
| Maximum | 90.0% | 73.5% |
| Range | 65.1% | 26.5% |
| Mean | 55.2% | 62.6% |
| Median | 56.2% | 62.7% |
| Interquartile 25% (IQ1) | 49.1% | 60.0% |
| Interquartile 75% (IQ3) | 61.6% | 65.6% |
| Interquartile Range (IQR) | 12.5% | 5.5% |
| Standard Deviation (Sample) | 10.9% | 5.5% |
| Standard Deviation (Population) | 10.8% | 5.4% |
Similar Demographics by In Labor Force | Age > 16
Demographics Similar to Spaniards by In Labor Force | Age > 16
In terms of in labor force | age > 16, the demographic groups most similar to Spaniards are Canadian (64.1%, a difference of 0.0%), Immigrants from England (64.2%, a difference of 0.010%), Cuban (64.2%, a difference of 0.020%), Irish (64.1%, a difference of 0.040%), and Dutch (64.2%, a difference of 0.060%).
| Demographics | Rating | Rank | In Labor Force | Age > 16 |
| Basques | 0.7 /100 | #261 | Tragic 64.2% |
| Finns | 0.7 /100 | #262 | Tragic 64.2% |
| Bahamians | 0.6 /100 | #263 | Tragic 64.2% |
| Dutch | 0.6 /100 | #264 | Tragic 64.2% |
| Cubans | 0.5 /100 | #265 | Tragic 64.2% |
| Immigrants | England | 0.5 /100 | #266 | Tragic 64.2% |
| Canadians | 0.5 /100 | #267 | Tragic 64.1% |
| Spaniards | 0.5 /100 | #268 | Tragic 64.1% |
| Irish | 0.4 /100 | #269 | Tragic 64.1% |
| Guyanese | 0.4 /100 | #270 | Tragic 64.1% |
| Dominicans | 0.4 /100 | #271 | Tragic 64.1% |
| Native Hawaiians | 0.3 /100 | #272 | Tragic 64.1% |
| Hmong | 0.3 /100 | #273 | Tragic 64.1% |
| Immigrants | Cuba | 0.3 /100 | #274 | Tragic 64.1% |
| Mexicans | 0.3 /100 | #275 | Tragic 64.1% |
Demographics Similar to Nepalese by In Labor Force | Age > 16
In terms of in labor force | age > 16, the demographic groups most similar to Nepalese are Hungarian (63.8%, a difference of 0.010%), Celtic (63.8%, a difference of 0.040%), Spanish American Indian (63.8%, a difference of 0.060%), Spanish (63.9%, a difference of 0.070%), and English (63.7%, a difference of 0.10%).
| Demographics | Rating | Rank | In Labor Force | Age > 16 |
| French | 0.1 /100 | #284 | Tragic 63.9% |
| Slovaks | 0.1 /100 | #285 | Tragic 63.9% |
| Immigrants | Austria | 0.1 /100 | #286 | Tragic 63.9% |
| Scottish | 0.1 /100 | #287 | Tragic 63.9% |
| Spanish | 0.1 /100 | #288 | Tragic 63.9% |
| Celtics | 0.1 /100 | #289 | Tragic 63.8% |
| Hungarians | 0.1 /100 | #290 | Tragic 63.8% |
| Nepalese | 0.1 /100 | #291 | Tragic 63.8% |
| Spanish American Indians | 0.1 /100 | #292 | Tragic 63.8% |
| English | 0.1 /100 | #293 | Tragic 63.7% |
| Puget Sound Salish | 0.0 /100 | #294 | Tragic 63.7% |
| Immigrants | Canada | 0.0 /100 | #295 | Tragic 63.7% |
| Immigrants | North America | 0.0 /100 | #296 | Tragic 63.7% |
| Immigrants | Grenada | 0.0 /100 | #297 | Tragic 63.6% |
| Comanche | 0.0 /100 | #298 | Tragic 63.6% |