Okinawan vs Nepalese In Labor Force | Age > 16
COMPARE
Okinawan
Nepalese
In Labor Force | Age > 16
In Labor Force | Age > 16 Comparison
Okinawans
Nepalese
65.9%
IN LABOR FORCE | AGE > 16
98.7/ 100
METRIC RATING
100th/ 347
METRIC RANK
63.8%
IN LABOR FORCE | AGE > 16
0.1/ 100
METRIC RATING
291st/ 347
METRIC RANK
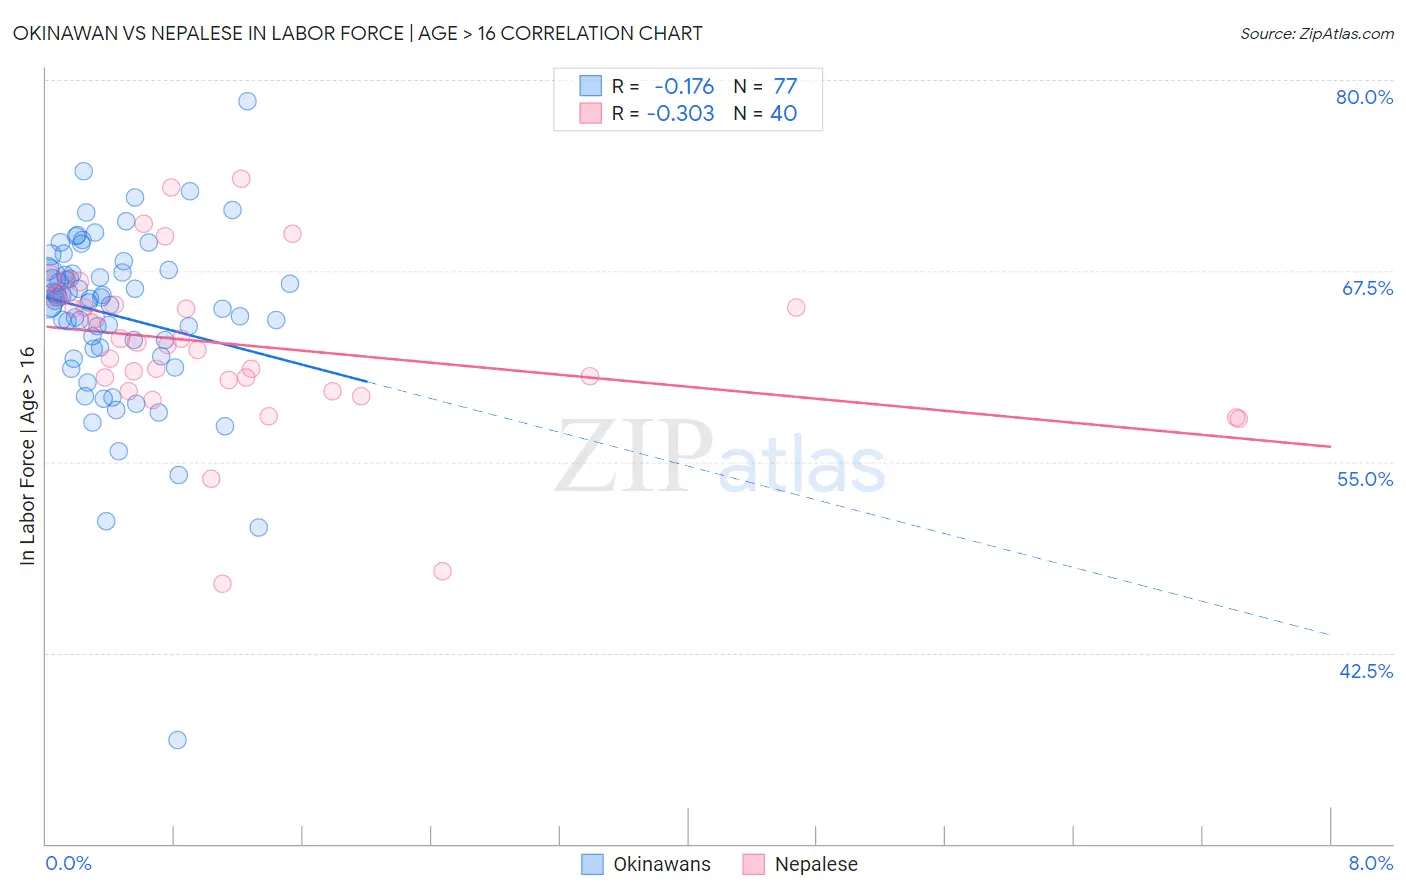
Okinawan vs Nepalese In Labor Force | Age > 16 Correlation Chart
The statistical analysis conducted on geographies consisting of 73,766,468 people shows a poor negative correlation between the proportion of Okinawans and labor force participation rate among population ages 16 and over in the United States with a correlation coefficient (R) of -0.176 and weighted average of 65.9%. Similarly, the statistical analysis conducted on geographies consisting of 24,521,755 people shows a mild negative correlation between the proportion of Nepalese and labor force participation rate among population ages 16 and over in the United States with a correlation coefficient (R) of -0.303 and weighted average of 63.8%, a difference of 3.3%.
In Labor Force | Age > 16 Correlation Summary
| Measurement | Okinawan | Nepalese |
| Minimum | 36.8% | 47.0% |
| Maximum | 78.6% | 73.5% |
| Range | 41.8% | 26.5% |
| Mean | 64.6% | 62.6% |
| Median | 65.7% | 62.7% |
| Interquartile 25% (IQ1) | 62.5% | 60.0% |
| Interquartile 75% (IQ3) | 67.5% | 65.6% |
| Interquartile Range (IQR) | 5.0% | 5.5% |
| Standard Deviation (Sample) | 5.8% | 5.5% |
| Standard Deviation (Population) | 5.8% | 5.4% |
Similar Demographics by In Labor Force | Age > 16
Demographics Similar to Okinawans by In Labor Force | Age > 16
In terms of in labor force | age > 16, the demographic groups most similar to Okinawans are Immigrants from Australia (65.9%, a difference of 0.0%), Immigrants from Colombia (65.9%, a difference of 0.010%), Uruguayan (65.9%, a difference of 0.010%), Immigrants from Chile (65.9%, a difference of 0.020%), and Immigrants from South Eastern Asia (65.9%, a difference of 0.030%).
| Demographics | Rating | Rank | In Labor Force | Age > 16 |
| Immigrants | South America | 99.1 /100 | #93 | Exceptional 66.0% |
| Immigrants | Cambodia | 99.1 /100 | #94 | Exceptional 66.0% |
| Immigrants | Uruguay | 99.1 /100 | #95 | Exceptional 66.0% |
| Bangladeshis | 98.9 /100 | #96 | Exceptional 65.9% |
| Filipinos | 98.9 /100 | #97 | Exceptional 65.9% |
| Immigrants | Chile | 98.7 /100 | #98 | Exceptional 65.9% |
| Immigrants | Australia | 98.7 /100 | #99 | Exceptional 65.9% |
| Okinawans | 98.7 /100 | #100 | Exceptional 65.9% |
| Immigrants | Colombia | 98.6 /100 | #101 | Exceptional 65.9% |
| Uruguayans | 98.6 /100 | #102 | Exceptional 65.9% |
| Immigrants | South Eastern Asia | 98.5 /100 | #103 | Exceptional 65.9% |
| Palestinians | 98.5 /100 | #104 | Exceptional 65.9% |
| Colombians | 98.4 /100 | #105 | Exceptional 65.9% |
| Immigrants | Serbia | 98.1 /100 | #106 | Exceptional 65.8% |
| Immigrants | Poland | 98.1 /100 | #107 | Exceptional 65.8% |
Demographics Similar to Nepalese by In Labor Force | Age > 16
In terms of in labor force | age > 16, the demographic groups most similar to Nepalese are Hungarian (63.8%, a difference of 0.010%), Celtic (63.8%, a difference of 0.040%), Spanish American Indian (63.8%, a difference of 0.060%), Spanish (63.9%, a difference of 0.070%), and English (63.7%, a difference of 0.10%).
| Demographics | Rating | Rank | In Labor Force | Age > 16 |
| French | 0.1 /100 | #284 | Tragic 63.9% |
| Slovaks | 0.1 /100 | #285 | Tragic 63.9% |
| Immigrants | Austria | 0.1 /100 | #286 | Tragic 63.9% |
| Scottish | 0.1 /100 | #287 | Tragic 63.9% |
| Spanish | 0.1 /100 | #288 | Tragic 63.9% |
| Celtics | 0.1 /100 | #289 | Tragic 63.8% |
| Hungarians | 0.1 /100 | #290 | Tragic 63.8% |
| Nepalese | 0.1 /100 | #291 | Tragic 63.8% |
| Spanish American Indians | 0.1 /100 | #292 | Tragic 63.8% |
| English | 0.1 /100 | #293 | Tragic 63.7% |
| Puget Sound Salish | 0.0 /100 | #294 | Tragic 63.7% |
| Immigrants | Canada | 0.0 /100 | #295 | Tragic 63.7% |
| Immigrants | North America | 0.0 /100 | #296 | Tragic 63.7% |
| Immigrants | Grenada | 0.0 /100 | #297 | Tragic 63.6% |
| Comanche | 0.0 /100 | #298 | Tragic 63.6% |