Immigrants from Serbia vs Immigrants from Grenada In Labor Force | Age 35-44
COMPARE
Immigrants from Serbia
Immigrants from Grenada
In Labor Force | Age 35-44
In Labor Force | Age 35-44 Comparison
Immigrants from Serbia
Immigrants from Grenada
85.5%
IN LABOR FORCE | AGE 35-44
100.0/ 100
METRIC RATING
20th/ 347
METRIC RANK
83.3%
IN LABOR FORCE | AGE 35-44
0.1/ 100
METRIC RATING
269th/ 347
METRIC RANK
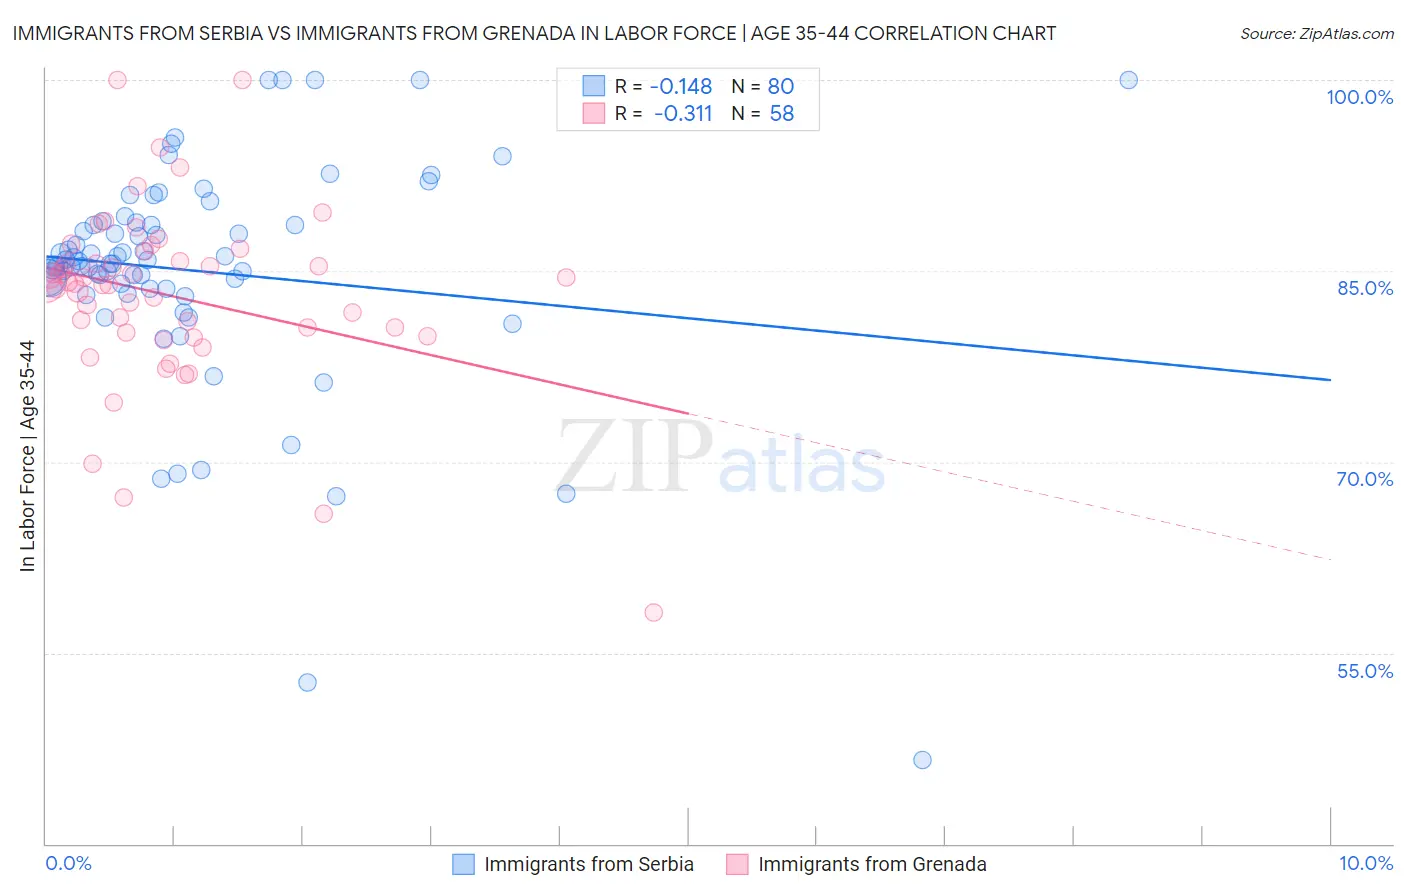
Immigrants from Serbia vs Immigrants from Grenada In Labor Force | Age 35-44 Correlation Chart
The statistical analysis conducted on geographies consisting of 131,723,933 people shows a poor negative correlation between the proportion of Immigrants from Serbia and labor force participation rate among population between the ages 35 and 44 in the United States with a correlation coefficient (R) of -0.148 and weighted average of 85.5%. Similarly, the statistical analysis conducted on geographies consisting of 67,194,907 people shows a mild negative correlation between the proportion of Immigrants from Grenada and labor force participation rate among population between the ages 35 and 44 in the United States with a correlation coefficient (R) of -0.311 and weighted average of 83.3%, a difference of 2.6%.
In Labor Force | Age 35-44 Correlation Summary
| Measurement | Immigrants from Serbia | Immigrants from Grenada |
| Minimum | 46.6% | 58.2% |
| Maximum | 100.0% | 100.0% |
| Range | 53.4% | 41.8% |
| Mean | 85.0% | 83.1% |
| Median | 85.7% | 84.0% |
| Interquartile 25% (IQ1) | 83.6% | 80.1% |
| Interquartile 75% (IQ3) | 88.7% | 85.8% |
| Interquartile Range (IQR) | 5.1% | 5.7% |
| Standard Deviation (Sample) | 9.0% | 7.0% |
| Standard Deviation (Population) | 8.9% | 7.0% |
Similar Demographics by In Labor Force | Age 35-44
Demographics Similar to Immigrants from Serbia by In Labor Force | Age 35-44
In terms of in labor force | age 35-44, the demographic groups most similar to Immigrants from Serbia are Slovene (85.6%, a difference of 0.040%), Immigrants from North Macedonia (85.6%, a difference of 0.050%), Carpatho Rusyn (85.6%, a difference of 0.050%), Bulgarian (85.5%, a difference of 0.060%), and Norwegian (85.6%, a difference of 0.10%).
| Demographics | Rating | Rank | In Labor Force | Age 35-44 |
| Somalis | 100.0 /100 | #13 | Exceptional 85.6% |
| Immigrants | Somalia | 100.0 /100 | #14 | Exceptional 85.6% |
| Norwegians | 100.0 /100 | #15 | Exceptional 85.6% |
| Immigrants | Ireland | 100.0 /100 | #16 | Exceptional 85.6% |
| Immigrants | North Macedonia | 100.0 /100 | #17 | Exceptional 85.6% |
| Carpatho Rusyns | 100.0 /100 | #18 | Exceptional 85.6% |
| Slovenes | 100.0 /100 | #19 | Exceptional 85.6% |
| Immigrants | Serbia | 100.0 /100 | #20 | Exceptional 85.5% |
| Bulgarians | 100.0 /100 | #21 | Exceptional 85.5% |
| Immigrants | Bosnia and Herzegovina | 100.0 /100 | #22 | Exceptional 85.4% |
| Immigrants | Eastern Africa | 100.0 /100 | #23 | Exceptional 85.4% |
| Latvians | 99.9 /100 | #24 | Exceptional 85.4% |
| Paraguayans | 99.9 /100 | #25 | Exceptional 85.4% |
| Immigrants | Liberia | 99.9 /100 | #26 | Exceptional 85.4% |
| Immigrants | Lithuania | 99.9 /100 | #27 | Exceptional 85.4% |
Demographics Similar to Immigrants from Grenada by In Labor Force | Age 35-44
In terms of in labor force | age 35-44, the demographic groups most similar to Immigrants from Grenada are Honduran (83.4%, a difference of 0.010%), Guamanian/Chamorro (83.4%, a difference of 0.040%), Spaniard (83.4%, a difference of 0.090%), Immigrants from Honduras (83.3%, a difference of 0.12%), and French American Indian (83.2%, a difference of 0.12%).
| Demographics | Rating | Rank | In Labor Force | Age 35-44 |
| Immigrants | Congo | 0.2 /100 | #262 | Tragic 83.5% |
| Iroquois | 0.2 /100 | #263 | Tragic 83.5% |
| Scotch-Irish | 0.1 /100 | #264 | Tragic 83.5% |
| Central Americans | 0.1 /100 | #265 | Tragic 83.5% |
| Spaniards | 0.1 /100 | #266 | Tragic 83.4% |
| Guamanians/Chamorros | 0.1 /100 | #267 | Tragic 83.4% |
| Hondurans | 0.1 /100 | #268 | Tragic 83.4% |
| Immigrants | Grenada | 0.1 /100 | #269 | Tragic 83.3% |
| Immigrants | Honduras | 0.0 /100 | #270 | Tragic 83.3% |
| French American Indians | 0.0 /100 | #271 | Tragic 83.2% |
| Immigrants | Fiji | 0.0 /100 | #272 | Tragic 83.2% |
| Spanish | 0.0 /100 | #273 | Tragic 83.2% |
| Immigrants | Nonimmigrants | 0.0 /100 | #274 | Tragic 83.2% |
| Hawaiians | 0.0 /100 | #275 | Tragic 83.2% |
| Delaware | 0.0 /100 | #276 | Tragic 83.2% |