Immigrants from Senegal vs Brazilian In Labor Force | Age 16-19
COMPARE
Immigrants from Senegal
Brazilian
In Labor Force | Age 16-19
In Labor Force | Age 16-19 Comparison
Immigrants from Senegal
Brazilians
35.3%
IN LABOR FORCE | AGE 16-19
5.5/ 100
METRIC RATING
228th/ 347
METRIC RANK
37.5%
IN LABOR FORCE | AGE 16-19
88.7/ 100
METRIC RATING
147th/ 347
METRIC RANK
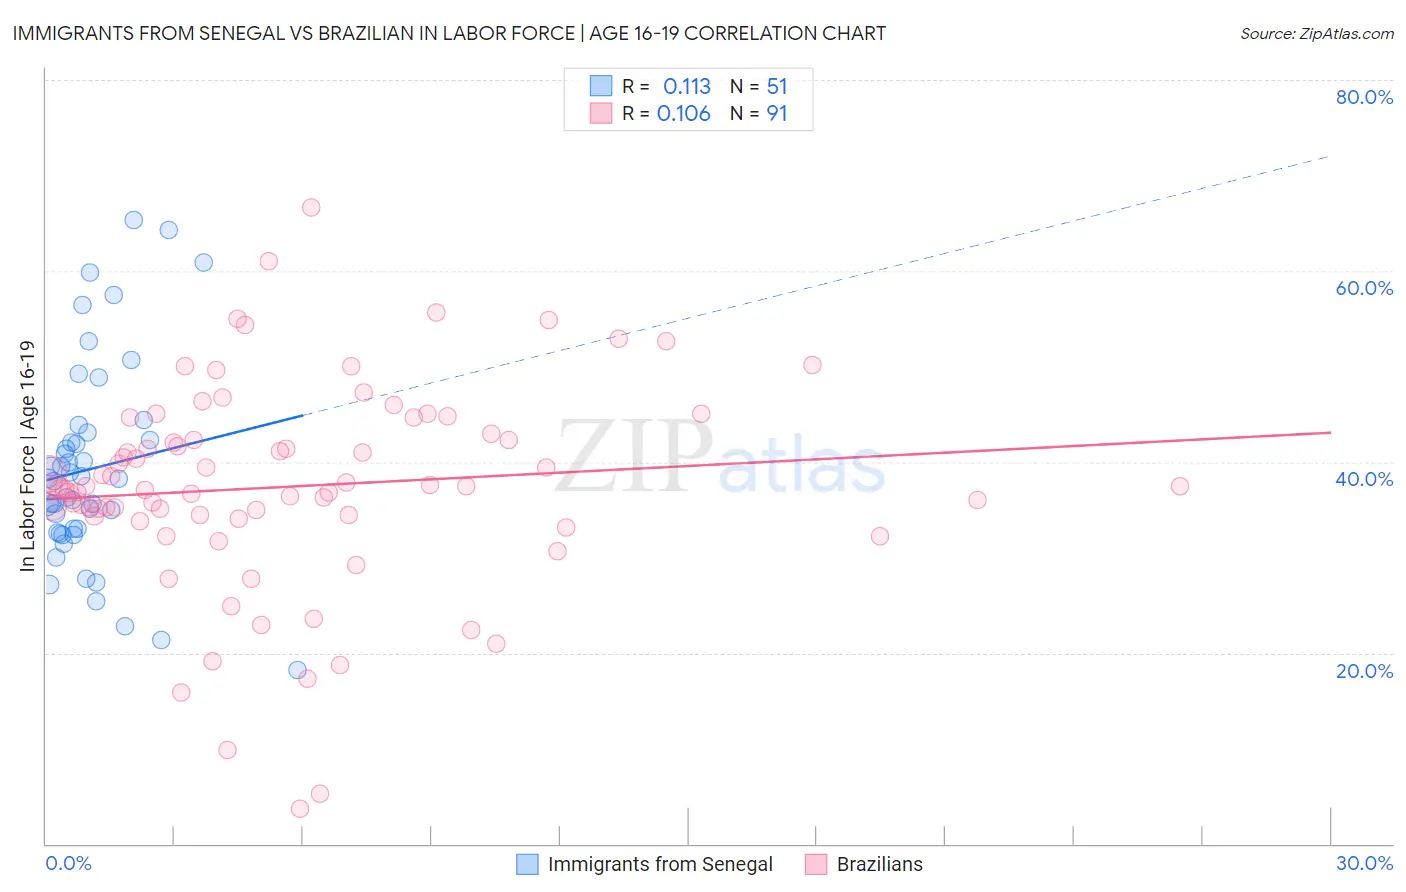
Immigrants from Senegal vs Brazilian In Labor Force | Age 16-19 Correlation Chart
The statistical analysis conducted on geographies consisting of 90,105,312 people shows a poor positive correlation between the proportion of Immigrants from Senegal and labor force participation rate among population between the ages 16 and 19 in the United States with a correlation coefficient (R) of 0.113 and weighted average of 35.3%. Similarly, the statistical analysis conducted on geographies consisting of 323,588,239 people shows a poor positive correlation between the proportion of Brazilians and labor force participation rate among population between the ages 16 and 19 in the United States with a correlation coefficient (R) of 0.106 and weighted average of 37.5%, a difference of 6.4%.
In Labor Force | Age 16-19 Correlation Summary
| Measurement | Immigrants from Senegal | Brazilian |
| Minimum | 18.2% | 3.7% |
| Maximum | 65.3% | 66.7% |
| Range | 47.1% | 63.0% |
| Mean | 39.3% | 37.4% |
| Median | 38.2% | 37.4% |
| Interquartile 25% (IQ1) | 32.6% | 34.3% |
| Interquartile 75% (IQ3) | 43.1% | 43.0% |
| Interquartile Range (IQR) | 10.5% | 8.7% |
| Standard Deviation (Sample) | 10.6% | 10.9% |
| Standard Deviation (Population) | 10.5% | 10.8% |
Similar Demographics by In Labor Force | Age 16-19
Demographics Similar to Immigrants from Senegal by In Labor Force | Age 16-19
In terms of in labor force | age 16-19, the demographic groups most similar to Immigrants from Senegal are Mongolian (35.3%, a difference of 0.050%), Immigrants from Guatemala (35.3%, a difference of 0.060%), Immigrants from Lebanon (35.2%, a difference of 0.13%), Immigrants from Belgium (35.3%, a difference of 0.15%), and Immigrants from Honduras (35.2%, a difference of 0.16%).
| Demographics | Rating | Rank | In Labor Force | Age 16-19 |
| Turks | 7.3 /100 | #221 | Tragic 35.4% |
| Immigrants | Ghana | 7.3 /100 | #222 | Tragic 35.4% |
| Ghanaians | 6.5 /100 | #223 | Tragic 35.3% |
| Hondurans | 6.5 /100 | #224 | Tragic 35.3% |
| Immigrants | Belgium | 6.1 /100 | #225 | Tragic 35.3% |
| Immigrants | Guatemala | 5.7 /100 | #226 | Tragic 35.3% |
| Mongolians | 5.7 /100 | #227 | Tragic 35.3% |
| Immigrants | Senegal | 5.5 /100 | #228 | Tragic 35.3% |
| Immigrants | Lebanon | 5.0 /100 | #229 | Tragic 35.2% |
| Immigrants | Honduras | 4.9 /100 | #230 | Tragic 35.2% |
| Immigrants | Syria | 4.5 /100 | #231 | Tragic 35.2% |
| Immigrants | Kazakhstan | 4.5 /100 | #232 | Tragic 35.2% |
| Immigrants | France | 4.3 /100 | #233 | Tragic 35.1% |
| Immigrants | Mexico | 4.2 /100 | #234 | Tragic 35.1% |
| Immigrants | Philippines | 4.0 /100 | #235 | Tragic 35.1% |
Demographics Similar to Brazilians by In Labor Force | Age 16-19
In terms of in labor force | age 16-19, the demographic groups most similar to Brazilians are Immigrants from Western Europe (37.5%, a difference of 0.030%), Japanese (37.5%, a difference of 0.080%), Paiute (37.5%, a difference of 0.080%), Pakistani (37.6%, a difference of 0.10%), and Sierra Leonean (37.6%, a difference of 0.13%).
| Demographics | Rating | Rank | In Labor Force | Age 16-19 |
| Estonians | 91.7 /100 | #140 | Exceptional 37.7% |
| Syrians | 90.7 /100 | #141 | Exceptional 37.6% |
| Sierra Leoneans | 89.7 /100 | #142 | Excellent 37.6% |
| Pakistanis | 89.5 /100 | #143 | Excellent 37.6% |
| Japanese | 89.3 /100 | #144 | Excellent 37.5% |
| Paiute | 89.3 /100 | #145 | Excellent 37.5% |
| Immigrants | Western Europe | 88.9 /100 | #146 | Excellent 37.5% |
| Brazilians | 88.7 /100 | #147 | Excellent 37.5% |
| Romanians | 87.3 /100 | #148 | Excellent 37.5% |
| Native Hawaiians | 85.0 /100 | #149 | Excellent 37.4% |
| Tsimshian | 84.7 /100 | #150 | Excellent 37.4% |
| Immigrants | Poland | 84.4 /100 | #151 | Excellent 37.3% |
| Immigrants | Sierra Leone | 83.6 /100 | #152 | Excellent 37.3% |
| Arapaho | 81.8 /100 | #153 | Excellent 37.3% |
| Immigrants | Bulgaria | 81.6 /100 | #154 | Excellent 37.3% |