Ottawa vs English In Labor Force | Age 30-34
COMPARE
Ottawa
English
In Labor Force | Age 30-34
In Labor Force | Age 30-34 Comparison
Ottawa
English
82.4%
IN LABOR FORCE | AGE 30-34
0.0/ 100
METRIC RATING
302nd/ 347
METRIC RANK
84.0%
IN LABOR FORCE | AGE 30-34
1.4/ 100
METRIC RATING
239th/ 347
METRIC RANK
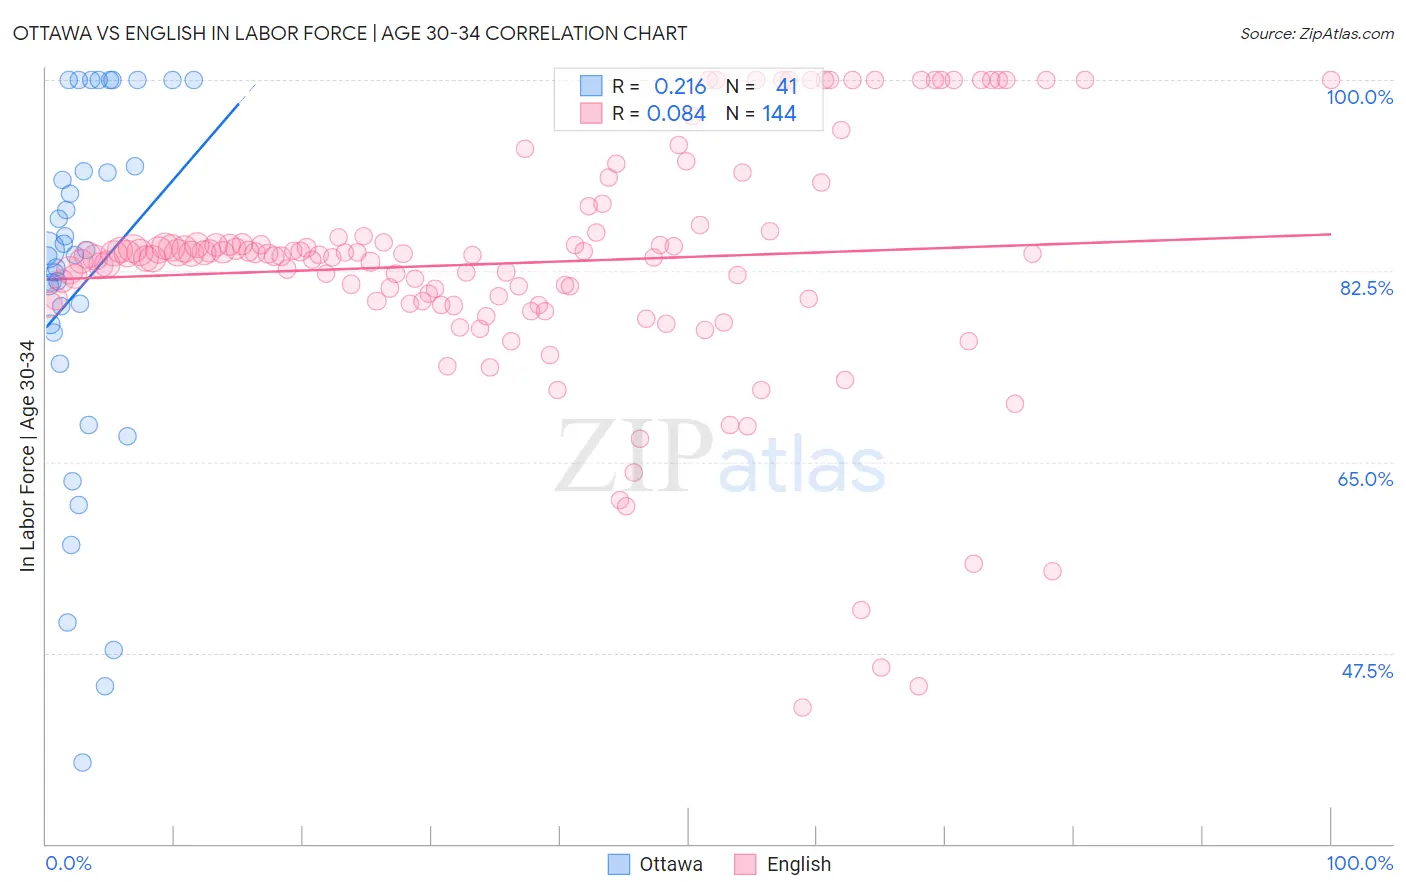
Ottawa vs English In Labor Force | Age 30-34 Correlation Chart
The statistical analysis conducted on geographies consisting of 49,951,540 people shows a weak positive correlation between the proportion of Ottawa and labor force participation rate among population between the ages 30 and 34 in the United States with a correlation coefficient (R) of 0.216 and weighted average of 82.4%. Similarly, the statistical analysis conducted on geographies consisting of 577,859,579 people shows a slight positive correlation between the proportion of English and labor force participation rate among population between the ages 30 and 34 in the United States with a correlation coefficient (R) of 0.084 and weighted average of 84.0%, a difference of 2.0%.
In Labor Force | Age 30-34 Correlation Summary
| Measurement | Ottawa | English |
| Minimum | 37.5% | 42.5% |
| Maximum | 100.0% | 100.0% |
| Range | 62.5% | 57.5% |
| Mean | 81.3% | 83.2% |
| Median | 84.0% | 84.0% |
| Interquartile 25% (IQ1) | 75.4% | 79.7% |
| Interquartile 75% (IQ3) | 91.9% | 85.6% |
| Interquartile Range (IQR) | 16.5% | 5.9% |
| Standard Deviation (Sample) | 16.5% | 11.1% |
| Standard Deviation (Population) | 16.3% | 11.0% |
Similar Demographics by In Labor Force | Age 30-34
Demographics Similar to Ottawa by In Labor Force | Age 30-34
In terms of in labor force | age 30-34, the demographic groups most similar to Ottawa are Immigrants from Micronesia (82.4%, a difference of 0.010%), Hispanic or Latino (82.4%, a difference of 0.030%), Hmong (82.4%, a difference of 0.040%), Tlingit-Haida (82.3%, a difference of 0.090%), and Immigrants from Central America (82.5%, a difference of 0.10%).
| Demographics | Rating | Rank | In Labor Force | Age 30-34 |
| Pennsylvania Germans | 0.0 /100 | #295 | Tragic 82.6% |
| Chippewa | 0.0 /100 | #296 | Tragic 82.6% |
| Comanche | 0.0 /100 | #297 | Tragic 82.6% |
| Aleuts | 0.0 /100 | #298 | Tragic 82.6% |
| Immigrants | Central America | 0.0 /100 | #299 | Tragic 82.5% |
| Hmong | 0.0 /100 | #300 | Tragic 82.4% |
| Hispanics or Latinos | 0.0 /100 | #301 | Tragic 82.4% |
| Ottawa | 0.0 /100 | #302 | Tragic 82.4% |
| Immigrants | Micronesia | 0.0 /100 | #303 | Tragic 82.4% |
| Tlingit-Haida | 0.0 /100 | #304 | Tragic 82.3% |
| Osage | 0.0 /100 | #305 | Tragic 82.3% |
| Spanish American Indians | 0.0 /100 | #306 | Tragic 82.2% |
| Menominee | 0.0 /100 | #307 | Tragic 82.2% |
| Puget Sound Salish | 0.0 /100 | #308 | Tragic 82.1% |
| Immigrants | Mexico | 0.0 /100 | #309 | Tragic 82.0% |
Demographics Similar to English by In Labor Force | Age 30-34
In terms of in labor force | age 30-34, the demographic groups most similar to English are Immigrants from Barbados (84.0%, a difference of 0.0%), Venezuelan (84.0%, a difference of 0.0%), Celtic (84.1%, a difference of 0.010%), U.S. Virgin Islander (84.1%, a difference of 0.020%), and Immigrants from Portugal (84.0%, a difference of 0.020%).
| Demographics | Rating | Rank | In Labor Force | Age 30-34 |
| Immigrants | Immigrants | 2.0 /100 | #232 | Tragic 84.1% |
| West Indians | 1.9 /100 | #233 | Tragic 84.1% |
| Haitians | 1.8 /100 | #234 | Tragic 84.1% |
| French American Indians | 1.7 /100 | #235 | Tragic 84.1% |
| U.S. Virgin Islanders | 1.5 /100 | #236 | Tragic 84.1% |
| Celtics | 1.4 /100 | #237 | Tragic 84.1% |
| Immigrants | Barbados | 1.4 /100 | #238 | Tragic 84.0% |
| English | 1.4 /100 | #239 | Tragic 84.0% |
| Venezuelans | 1.3 /100 | #240 | Tragic 84.0% |
| Immigrants | Portugal | 1.2 /100 | #241 | Tragic 84.0% |
| Immigrants | Oceania | 1.1 /100 | #242 | Tragic 84.0% |
| Immigrants | Caribbean | 1.1 /100 | #243 | Tragic 84.0% |
| Basques | 0.9 /100 | #244 | Tragic 84.0% |
| Immigrants | Venezuela | 0.9 /100 | #245 | Tragic 84.0% |
| Central Americans | 0.9 /100 | #246 | Tragic 84.0% |