Immigrants from Scotland vs Belgian Average Family Size
COMPARE
Immigrants from Scotland
Belgian
Average Family Size
Average Family Size Comparison
Immigrants from Scotland
Belgians
3.12
AVERAGE FAMILY SIZE
0.1/ 100
METRIC RATING
315th/ 347
METRIC RANK
3.11
AVERAGE FAMILY SIZE
0.0/ 100
METRIC RATING
329th/ 347
METRIC RANK
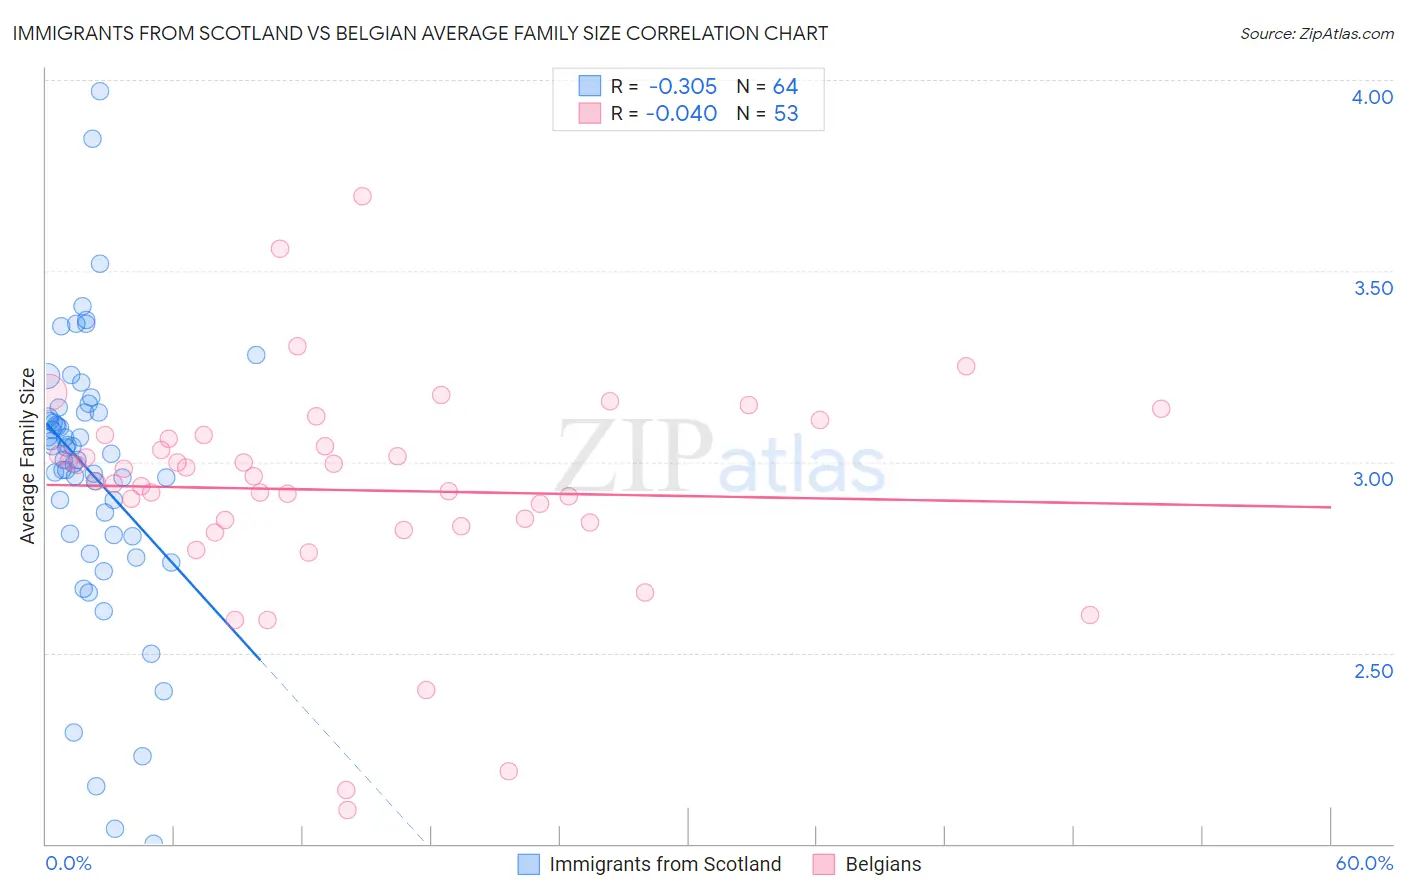
Immigrants from Scotland vs Belgian Average Family Size Correlation Chart
The statistical analysis conducted on geographies consisting of 196,383,417 people shows a mild negative correlation between the proportion of Immigrants from Scotland and average family size in the United States with a correlation coefficient (R) of -0.305 and weighted average of 3.12. Similarly, the statistical analysis conducted on geographies consisting of 355,849,592 people shows no correlation between the proportion of Belgians and average family size in the United States with a correlation coefficient (R) of -0.040 and weighted average of 3.11, a difference of 0.54%.
Average Family Size Correlation Summary
| Measurement | Immigrants from Scotland | Belgian |
| Minimum | 2.00 | 2.09 |
| Maximum | 3.97 | 3.70 |
| Range | 1.97 | 1.61 |
| Mean | 2.97 | 2.93 |
| Median | 3.03 | 2.96 |
| Interquartile 25% (IQ1) | 2.81 | 2.83 |
| Interquartile 75% (IQ3) | 3.13 | 3.07 |
| Interquartile Range (IQR) | 0.32 | 0.23 |
| Standard Deviation (Sample) | 0.36 | 0.29 |
| Standard Deviation (Population) | 0.36 | 0.29 |
Demographics Similar to Immigrants from Scotland and Belgians by Average Family Size
In terms of average family size, the demographic groups most similar to Immigrants from Scotland are Russian (3.12, a difference of 0.020%), Immigrants from Australia (3.13, a difference of 0.060%), Bulgarian (3.13, a difference of 0.060%), Serbian (3.12, a difference of 0.090%), and Italian (3.12, a difference of 0.15%). Similarly, the demographic groups most similar to Belgians are Dutch (3.11, a difference of 0.060%), Czech (3.11, a difference of 0.060%), Latvian (3.11, a difference of 0.060%), Scotch-Irish (3.11, a difference of 0.060%), and Scottish (3.11, a difference of 0.060%).
| Demographics | Rating | Rank | Average Family Size |
| Immigrants | Australia | 0.1 /100 | #312 | Tragic 3.13 |
| Bulgarians | 0.1 /100 | #313 | Tragic 3.13 |
| Russians | 0.1 /100 | #314 | Tragic 3.12 |
| Immigrants | Scotland | 0.1 /100 | #315 | Tragic 3.12 |
| Serbians | 0.1 /100 | #316 | Tragic 3.12 |
| Italians | 0.1 /100 | #317 | Tragic 3.12 |
| Eastern Europeans | 0.1 /100 | #318 | Tragic 3.12 |
| Welsh | 0.1 /100 | #319 | Tragic 3.12 |
| Immigrants | North America | 0.0 /100 | #320 | Tragic 3.12 |
| Immigrants | Austria | 0.0 /100 | #321 | Tragic 3.12 |
| Immigrants | Canada | 0.0 /100 | #322 | Tragic 3.12 |
| Soviet Union | 0.0 /100 | #323 | Tragic 3.11 |
| Celtics | 0.0 /100 | #324 | Tragic 3.11 |
| English | 0.0 /100 | #325 | Tragic 3.11 |
| Ottawa | 0.0 /100 | #326 | Tragic 3.11 |
| Dutch | 0.0 /100 | #327 | Tragic 3.11 |
| Czechs | 0.0 /100 | #328 | Tragic 3.11 |
| Belgians | 0.0 /100 | #329 | Tragic 3.11 |
| Latvians | 0.0 /100 | #330 | Tragic 3.11 |
| Scotch-Irish | 0.0 /100 | #331 | Tragic 3.11 |
| Scottish | 0.0 /100 | #332 | Tragic 3.11 |