Immigrants from Russia vs Immigrants from Bosnia and Herzegovina In Labor Force | Age 25-29
COMPARE
Immigrants from Russia
Immigrants from Bosnia and Herzegovina
In Labor Force | Age 25-29
In Labor Force | Age 25-29 Comparison
Immigrants from Russia
Immigrants from Bosnia and Herzegovina
84.9%
IN LABOR FORCE | AGE 25-29
81.6/ 100
METRIC RATING
129th/ 347
METRIC RANK
86.3%
IN LABOR FORCE | AGE 25-29
100.0/ 100
METRIC RATING
7th/ 347
METRIC RANK
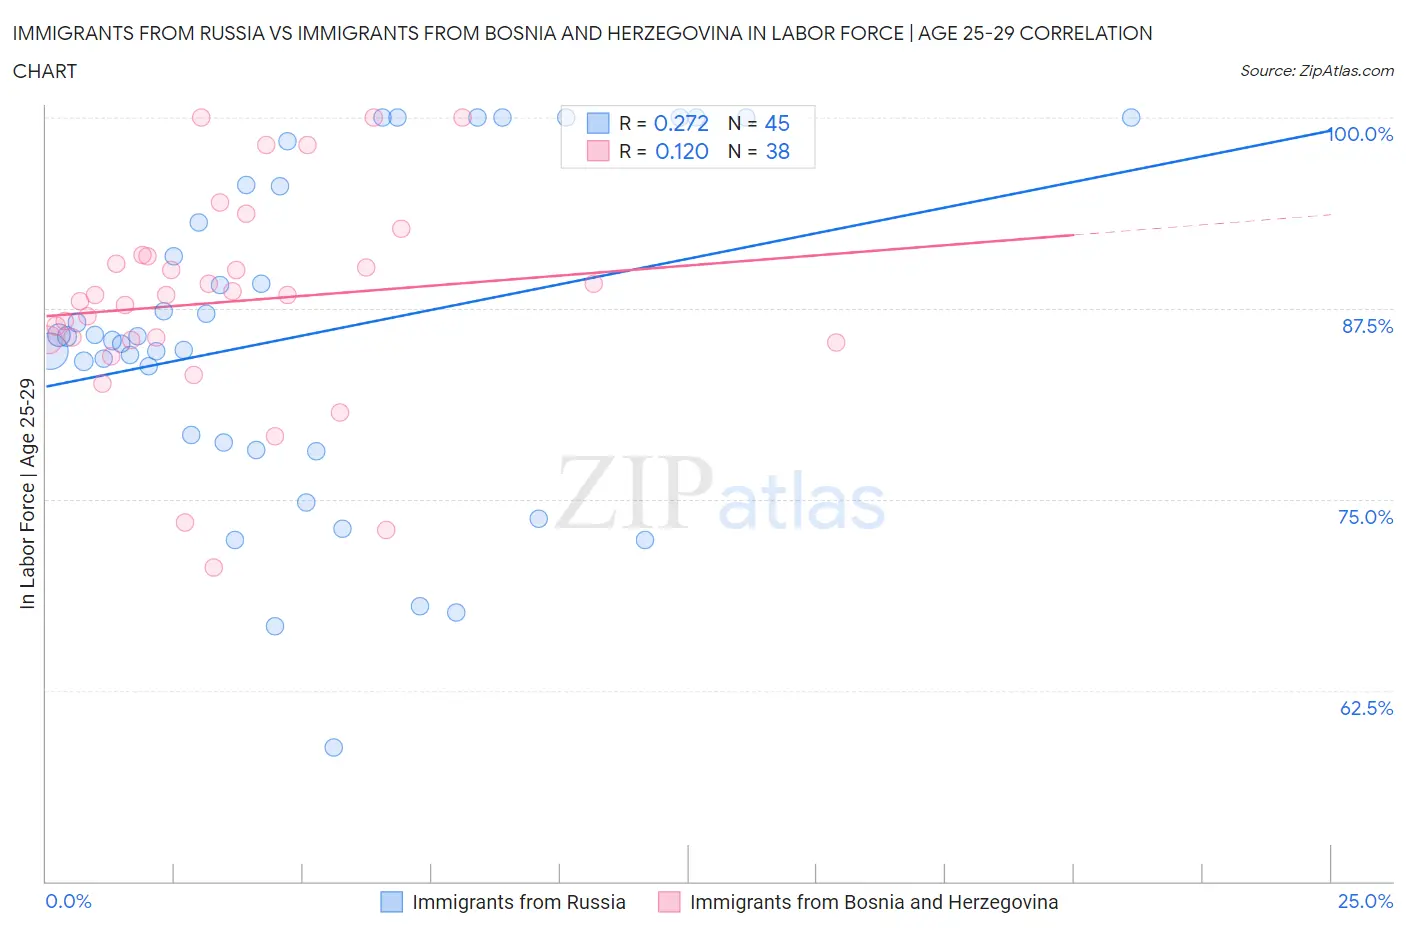
Immigrants from Russia vs Immigrants from Bosnia and Herzegovina In Labor Force | Age 25-29 Correlation Chart
The statistical analysis conducted on geographies consisting of 347,809,733 people shows a weak positive correlation between the proportion of Immigrants from Russia and labor force participation rate among population between the ages 25 and 29 in the United States with a correlation coefficient (R) of 0.272 and weighted average of 84.9%. Similarly, the statistical analysis conducted on geographies consisting of 156,815,563 people shows a poor positive correlation between the proportion of Immigrants from Bosnia and Herzegovina and labor force participation rate among population between the ages 25 and 29 in the United States with a correlation coefficient (R) of 0.120 and weighted average of 86.3%, a difference of 1.6%.
In Labor Force | Age 25-29 Correlation Summary
| Measurement | Immigrants from Russia | Immigrants from Bosnia and Herzegovina |
| Minimum | 58.8% | 70.6% |
| Maximum | 100.0% | 100.0% |
| Range | 41.2% | 29.4% |
| Mean | 85.7% | 87.9% |
| Median | 85.7% | 88.4% |
| Interquartile 25% (IQ1) | 78.5% | 85.4% |
| Interquartile 75% (IQ3) | 95.5% | 90.9% |
| Interquartile Range (IQR) | 17.1% | 5.5% |
| Standard Deviation (Sample) | 10.7% | 6.9% |
| Standard Deviation (Population) | 10.6% | 6.8% |
Similar Demographics by In Labor Force | Age 25-29
Demographics Similar to Immigrants from Russia by In Labor Force | Age 25-29
In terms of in labor force | age 25-29, the demographic groups most similar to Immigrants from Russia are Northern European (84.9%, a difference of 0.0%), Immigrants from Uruguay (84.9%, a difference of 0.030%), Australian (84.9%, a difference of 0.030%), Dutch (84.9%, a difference of 0.040%), and Immigrants from Iran (84.9%, a difference of 0.040%).
| Demographics | Rating | Rank | In Labor Force | Age 25-29 |
| Scandinavians | 85.1 /100 | #122 | Excellent 84.9% |
| Dutch | 84.9 /100 | #123 | Excellent 84.9% |
| Immigrants | Iran | 84.8 /100 | #124 | Excellent 84.9% |
| Uruguayans | 84.7 /100 | #125 | Excellent 84.9% |
| Immigrants | Singapore | 84.4 /100 | #126 | Excellent 84.9% |
| Immigrants | Uruguay | 84.0 /100 | #127 | Excellent 84.9% |
| Australians | 83.6 /100 | #128 | Excellent 84.9% |
| Immigrants | Russia | 81.6 /100 | #129 | Excellent 84.9% |
| Northern Europeans | 81.3 /100 | #130 | Excellent 84.9% |
| Iranians | 78.1 /100 | #131 | Good 84.8% |
| Romanians | 77.7 /100 | #132 | Good 84.8% |
| Asians | 77.7 /100 | #133 | Good 84.8% |
| Syrians | 76.5 /100 | #134 | Good 84.8% |
| Immigrants | Hungary | 76.4 /100 | #135 | Good 84.8% |
| Bhutanese | 76.0 /100 | #136 | Good 84.8% |
Demographics Similar to Immigrants from Bosnia and Herzegovina by In Labor Force | Age 25-29
In terms of in labor force | age 25-29, the demographic groups most similar to Immigrants from Bosnia and Herzegovina are Immigrants from Cabo Verde (86.2%, a difference of 0.070%), Ethiopian (86.2%, a difference of 0.10%), Slovene (86.4%, a difference of 0.12%), Liberian (86.1%, a difference of 0.15%), and Immigrants from Ethiopia (86.1%, a difference of 0.15%).
| Demographics | Rating | Rank | In Labor Force | Age 25-29 |
| Tsimshian | 100.0 /100 | #1 | Exceptional 88.7% |
| Immigrants | Somalia | 100.0 /100 | #2 | Exceptional 87.1% |
| Somalis | 100.0 /100 | #3 | Exceptional 87.1% |
| Carpatho Rusyns | 100.0 /100 | #4 | Exceptional 87.0% |
| Luxembourgers | 100.0 /100 | #5 | Exceptional 86.9% |
| Slovenes | 100.0 /100 | #6 | Exceptional 86.4% |
| Immigrants | Bosnia and Herzegovina | 100.0 /100 | #7 | Exceptional 86.3% |
| Immigrants | Cabo Verde | 100.0 /100 | #8 | Exceptional 86.2% |
| Ethiopians | 100.0 /100 | #9 | Exceptional 86.2% |
| Liberians | 100.0 /100 | #10 | Exceptional 86.1% |
| Immigrants | Ethiopia | 100.0 /100 | #11 | Exceptional 86.1% |
| Immigrants | Lithuania | 100.0 /100 | #12 | Exceptional 86.1% |
| Norwegians | 100.0 /100 | #13 | Exceptional 86.1% |
| Latvians | 100.0 /100 | #14 | Exceptional 86.1% |
| Bolivians | 100.0 /100 | #15 | Exceptional 86.1% |