Immigrants from Romania vs Yugoslavian Single Mother Households
COMPARE
Immigrants from Romania
Yugoslavian
Single Mother Households
Single Mother Households Comparison
Immigrants from Romania
Yugoslavians
5.5%
SINGLE MOTHER HOUSEHOLDS
99.0/ 100
METRIC RATING
56th/ 347
METRIC RANK
6.1%
SINGLE MOTHER HOUSEHOLDS
73.1/ 100
METRIC RATING
159th/ 347
METRIC RANK
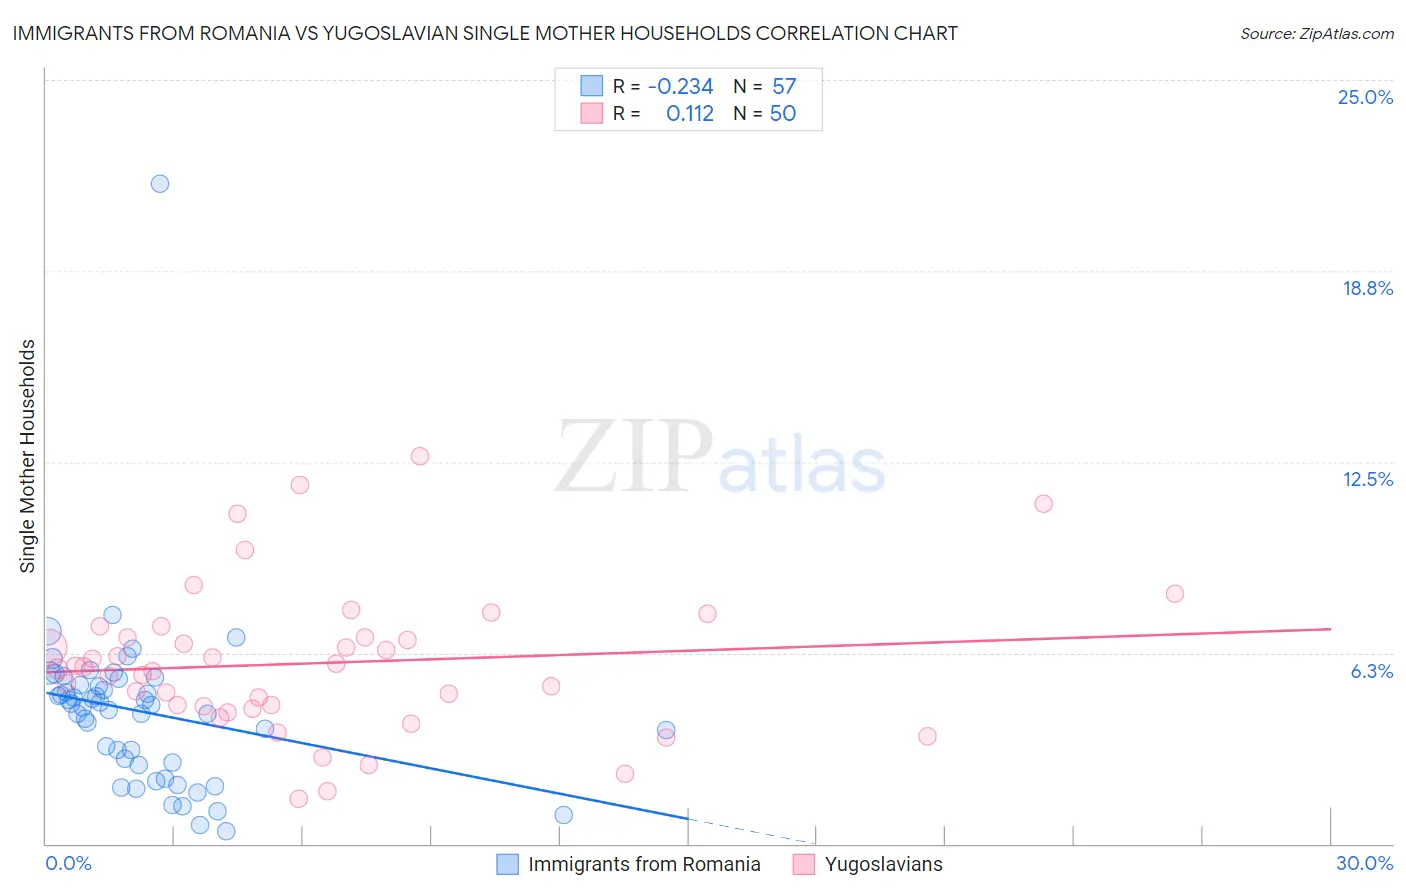
Immigrants from Romania vs Yugoslavian Single Mother Households Correlation Chart
The statistical analysis conducted on geographies consisting of 256,535,689 people shows a weak negative correlation between the proportion of Immigrants from Romania and percentage of single mother households in the United States with a correlation coefficient (R) of -0.234 and weighted average of 5.5%. Similarly, the statistical analysis conducted on geographies consisting of 285,023,099 people shows a poor positive correlation between the proportion of Yugoslavians and percentage of single mother households in the United States with a correlation coefficient (R) of 0.112 and weighted average of 6.1%, a difference of 11.4%.
Single Mother Households Correlation Summary
| Measurement | Immigrants from Romania | Yugoslavian |
| Minimum | 0.41% | 1.5% |
| Maximum | 21.6% | 12.7% |
| Range | 21.2% | 11.2% |
| Mean | 4.3% | 5.9% |
| Median | 4.6% | 5.8% |
| Interquartile 25% (IQ1) | 2.6% | 4.5% |
| Interquartile 75% (IQ3) | 5.3% | 6.7% |
| Interquartile Range (IQR) | 2.7% | 2.3% |
| Standard Deviation (Sample) | 2.9% | 2.4% |
| Standard Deviation (Population) | 2.9% | 2.4% |
Similar Demographics by Single Mother Households
Demographics Similar to Immigrants from Romania by Single Mother Households
In terms of single mother households, the demographic groups most similar to Immigrants from Romania are Immigrants from Denmark (5.5%, a difference of 0.070%), Immigrants from Europe (5.5%, a difference of 0.080%), Immigrants from Lebanon (5.5%, a difference of 0.24%), Immigrants from Russia (5.5%, a difference of 0.26%), and Danish (5.5%, a difference of 0.32%).
| Demographics | Rating | Rank | Single Mother Households |
| Immigrants | Latvia | 99.2 /100 | #49 | Exceptional 5.5% |
| Immigrants | Scotland | 99.2 /100 | #50 | Exceptional 5.5% |
| Immigrants | Belarus | 99.2 /100 | #51 | Exceptional 5.5% |
| Swedes | 99.1 /100 | #52 | Exceptional 5.5% |
| Immigrants | Russia | 99.1 /100 | #53 | Exceptional 5.5% |
| Immigrants | Lebanon | 99.1 /100 | #54 | Exceptional 5.5% |
| Immigrants | Denmark | 99.1 /100 | #55 | Exceptional 5.5% |
| Immigrants | Romania | 99.0 /100 | #56 | Exceptional 5.5% |
| Immigrants | Europe | 99.0 /100 | #57 | Exceptional 5.5% |
| Danes | 98.9 /100 | #58 | Exceptional 5.5% |
| Luxembourgers | 98.7 /100 | #59 | Exceptional 5.6% |
| Immigrants | Norway | 98.7 /100 | #60 | Exceptional 5.6% |
| Australians | 98.7 /100 | #61 | Exceptional 5.6% |
| Poles | 98.6 /100 | #62 | Exceptional 5.6% |
| Immigrants | North Macedonia | 98.6 /100 | #63 | Exceptional 5.6% |
Demographics Similar to Yugoslavians by Single Mother Households
In terms of single mother households, the demographic groups most similar to Yugoslavians are Iraqi (6.1%, a difference of 0.010%), Celtic (6.1%, a difference of 0.040%), Immigrants from Germany (6.1%, a difference of 0.090%), Chilean (6.1%, a difference of 0.17%), and Native Hawaiian (6.1%, a difference of 0.28%).
| Demographics | Rating | Rank | Single Mother Households |
| Pakistanis | 79.2 /100 | #152 | Good 6.1% |
| Immigrants | Brazil | 78.9 /100 | #153 | Good 6.1% |
| Immigrants | Philippines | 78.5 /100 | #154 | Good 6.1% |
| Whites/Caucasians | 76.5 /100 | #155 | Good 6.1% |
| Native Hawaiians | 75.0 /100 | #156 | Good 6.1% |
| Chileans | 74.2 /100 | #157 | Good 6.1% |
| Celtics | 73.3 /100 | #158 | Good 6.1% |
| Yugoslavians | 73.1 /100 | #159 | Good 6.1% |
| Iraqis | 73.0 /100 | #160 | Good 6.1% |
| Immigrants | Germany | 72.4 /100 | #161 | Good 6.1% |
| Immigrants | Zimbabwe | 69.9 /100 | #162 | Good 6.2% |
| Alsatians | 68.7 /100 | #163 | Good 6.2% |
| Immigrants | Northern Africa | 68.0 /100 | #164 | Good 6.2% |
| Immigrants | Syria | 67.4 /100 | #165 | Good 6.2% |
| Sri Lankans | 63.9 /100 | #166 | Good 6.2% |