Immigrants from Romania vs Yugoslavian 9th Grade
COMPARE
Immigrants from Romania
Yugoslavian
9th Grade
9th Grade Comparison
Immigrants from Romania
Yugoslavians
95.4%
9TH GRADE
95.6/ 100
METRIC RATING
117th/ 347
METRIC RANK
95.7%
9TH GRADE
98.9/ 100
METRIC RATING
89th/ 347
METRIC RANK
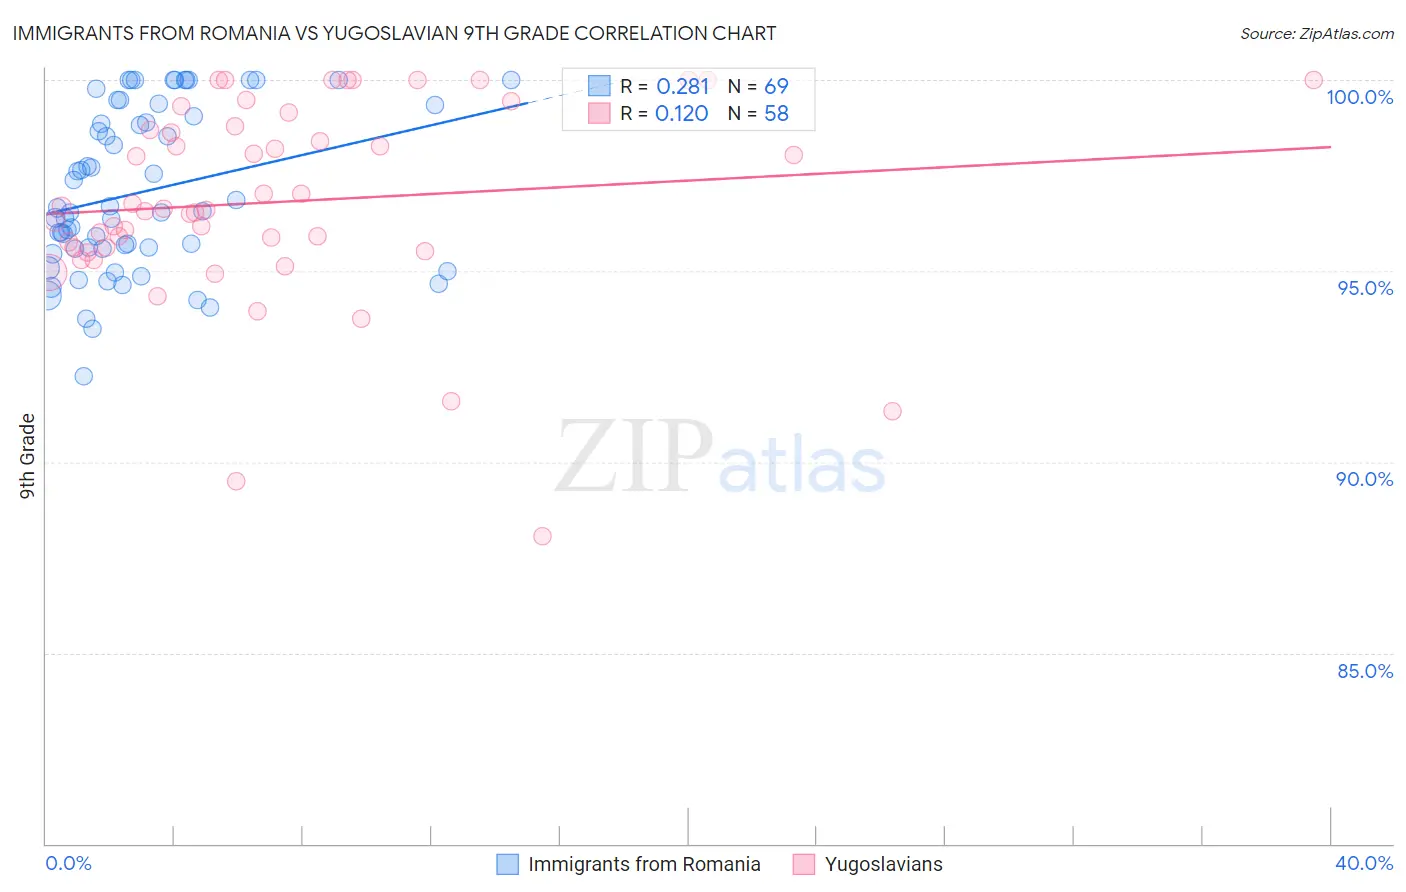
Immigrants from Romania vs Yugoslavian 9th Grade Correlation Chart
The statistical analysis conducted on geographies consisting of 257,008,799 people shows a weak positive correlation between the proportion of Immigrants from Romania and percentage of population with at least 9th grade education in the United States with a correlation coefficient (R) of 0.281 and weighted average of 95.4%. Similarly, the statistical analysis conducted on geographies consisting of 285,683,014 people shows a poor positive correlation between the proportion of Yugoslavians and percentage of population with at least 9th grade education in the United States with a correlation coefficient (R) of 0.120 and weighted average of 95.7%, a difference of 0.25%.
9th Grade Correlation Summary
| Measurement | Immigrants from Romania | Yugoslavian |
| Minimum | 92.3% | 88.0% |
| Maximum | 100.0% | 100.0% |
| Range | 7.7% | 12.0% |
| Mean | 97.1% | 96.8% |
| Median | 96.6% | 96.6% |
| Interquartile 25% (IQ1) | 95.6% | 95.6% |
| Interquartile 75% (IQ3) | 99.2% | 98.8% |
| Interquartile Range (IQR) | 3.6% | 3.2% |
| Standard Deviation (Sample) | 2.1% | 2.6% |
| Standard Deviation (Population) | 2.1% | 2.6% |
Similar Demographics by 9th Grade
Demographics Similar to Immigrants from Romania by 9th Grade
In terms of 9th grade, the demographic groups most similar to Immigrants from Romania are Immigrants from Europe (95.4%, a difference of 0.0%), Immigrants from Turkey (95.4%, a difference of 0.0%), Soviet Union (95.4%, a difference of 0.0%), Cambodian (95.4%, a difference of 0.0%), and Cree (95.4%, a difference of 0.0%).
| Demographics | Rating | Rank | 9th Grade |
| Immigrants | Bulgaria | 96.7 /100 | #110 | Exceptional 95.5% |
| Cherokee | 96.3 /100 | #111 | Exceptional 95.4% |
| Immigrants | Croatia | 96.2 /100 | #112 | Exceptional 95.4% |
| Iroquois | 96.2 /100 | #113 | Exceptional 95.4% |
| German Russians | 96.1 /100 | #114 | Exceptional 95.4% |
| Burmese | 96.0 /100 | #115 | Exceptional 95.4% |
| Immigrants | Europe | 95.7 /100 | #116 | Exceptional 95.4% |
| Immigrants | Romania | 95.6 /100 | #117 | Exceptional 95.4% |
| Immigrants | Turkey | 95.6 /100 | #118 | Exceptional 95.4% |
| Soviet Union | 95.6 /100 | #119 | Exceptional 95.4% |
| Cambodians | 95.6 /100 | #120 | Exceptional 95.4% |
| Cree | 95.5 /100 | #121 | Exceptional 95.4% |
| Immigrants | Kuwait | 95.5 /100 | #122 | Exceptional 95.4% |
| Kiowa | 95.3 /100 | #123 | Exceptional 95.4% |
| Shoshone | 95.3 /100 | #124 | Exceptional 95.4% |
Demographics Similar to Yugoslavians by 9th Grade
In terms of 9th grade, the demographic groups most similar to Yugoslavians are Immigrants from Czechoslovakia (95.7%, a difference of 0.0%), South African (95.6%, a difference of 0.010%), Creek (95.6%, a difference of 0.010%), Okinawan (95.7%, a difference of 0.020%), and Immigrants from Saudi Arabia (95.6%, a difference of 0.020%).
| Demographics | Rating | Rank | 9th Grade |
| Puget Sound Salish | 99.2 /100 | #82 | Exceptional 95.7% |
| Swiss | 99.2 /100 | #83 | Exceptional 95.7% |
| Immigrants | Denmark | 99.1 /100 | #84 | Exceptional 95.7% |
| Icelanders | 99.1 /100 | #85 | Exceptional 95.7% |
| Immigrants | Western Europe | 99.1 /100 | #86 | Exceptional 95.7% |
| Okinawans | 99.0 /100 | #87 | Exceptional 95.7% |
| Immigrants | Czechoslovakia | 98.9 /100 | #88 | Exceptional 95.7% |
| Yugoslavians | 98.9 /100 | #89 | Exceptional 95.7% |
| South Africans | 98.8 /100 | #90 | Exceptional 95.6% |
| Creek | 98.8 /100 | #91 | Exceptional 95.6% |
| Immigrants | Saudi Arabia | 98.8 /100 | #92 | Exceptional 95.6% |
| Immigrants | Germany | 98.7 /100 | #93 | Exceptional 95.6% |
| Immigrants | Latvia | 98.7 /100 | #94 | Exceptional 95.6% |
| Americans | 98.5 /100 | #95 | Exceptional 95.6% |
| Filipinos | 98.5 /100 | #96 | Exceptional 95.6% |