Immigrants from Portugal vs Immigrants from Turkey In Labor Force | Age 30-34
COMPARE
Immigrants from Portugal
Immigrants from Turkey
In Labor Force | Age 30-34
In Labor Force | Age 30-34 Comparison
Immigrants from Portugal
Immigrants from Turkey
84.0%
IN LABOR FORCE | AGE 30-34
1.2/ 100
METRIC RATING
241st/ 347
METRIC RANK
85.5%
IN LABOR FORCE | AGE 30-34
99.6/ 100
METRIC RATING
55th/ 347
METRIC RANK
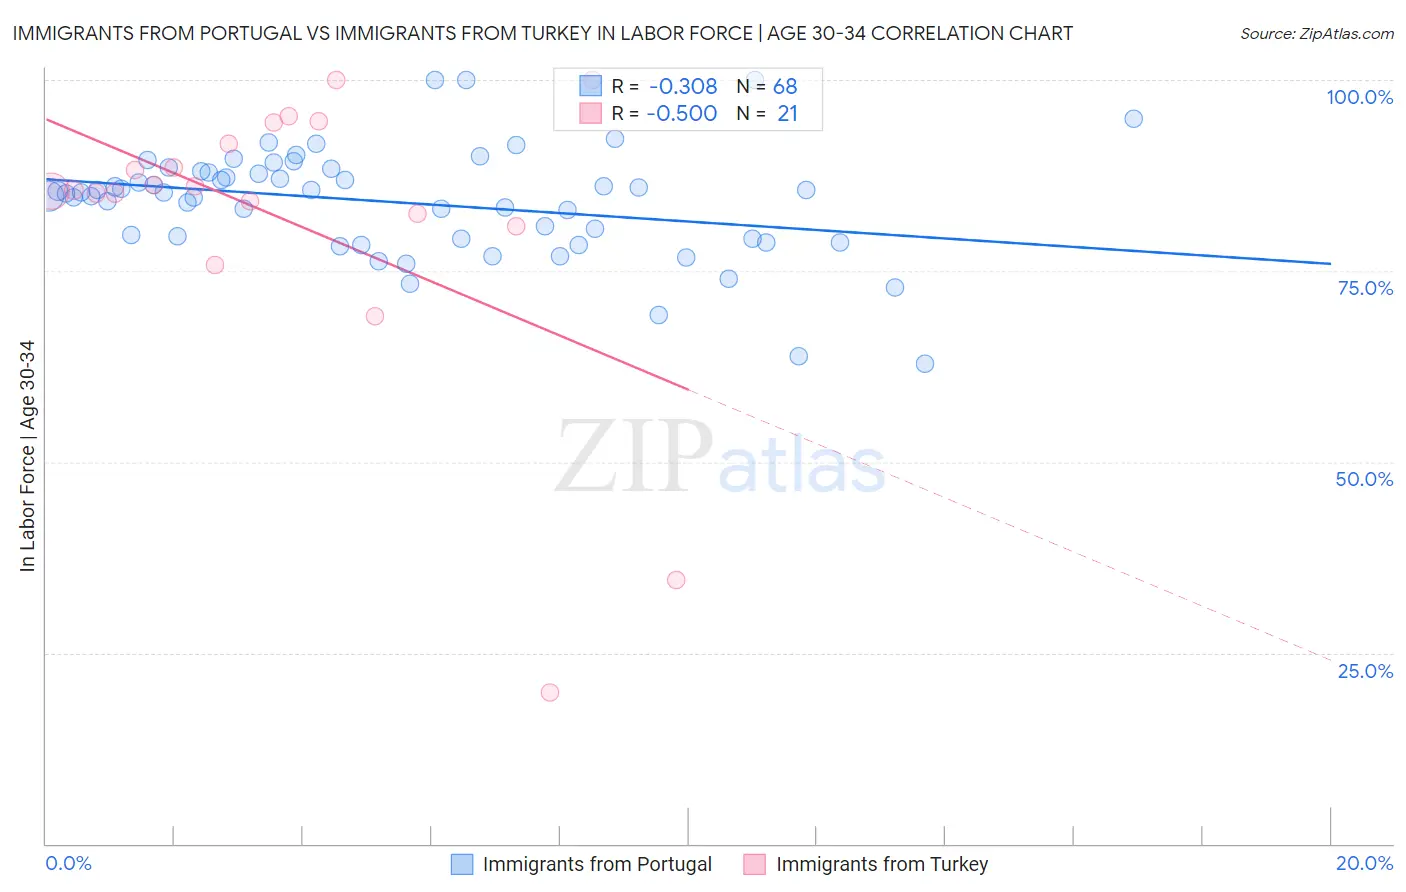
Immigrants from Portugal vs Immigrants from Turkey In Labor Force | Age 30-34 Correlation Chart
The statistical analysis conducted on geographies consisting of 174,756,515 people shows a mild negative correlation between the proportion of Immigrants from Portugal and labor force participation rate among population between the ages 30 and 34 in the United States with a correlation coefficient (R) of -0.308 and weighted average of 84.0%. Similarly, the statistical analysis conducted on geographies consisting of 222,992,305 people shows a moderate negative correlation between the proportion of Immigrants from Turkey and labor force participation rate among population between the ages 30 and 34 in the United States with a correlation coefficient (R) of -0.500 and weighted average of 85.5%, a difference of 1.8%.
In Labor Force | Age 30-34 Correlation Summary
| Measurement | Immigrants from Portugal | Immigrants from Turkey |
| Minimum | 62.8% | 19.8% |
| Maximum | 100.0% | 100.0% |
| Range | 37.2% | 80.2% |
| Mean | 84.0% | 81.6% |
| Median | 85.3% | 85.6% |
| Interquartile 25% (IQ1) | 79.2% | 81.7% |
| Interquartile 75% (IQ3) | 88.0% | 93.0% |
| Interquartile Range (IQR) | 8.8% | 11.3% |
| Standard Deviation (Sample) | 7.2% | 19.7% |
| Standard Deviation (Population) | 7.1% | 19.2% |
Similar Demographics by In Labor Force | Age 30-34
Demographics Similar to Immigrants from Portugal by In Labor Force | Age 30-34
In terms of in labor force | age 30-34, the demographic groups most similar to Immigrants from Portugal are Immigrants from Oceania (84.0%, a difference of 0.010%), English (84.0%, a difference of 0.020%), Venezuelan (84.0%, a difference of 0.020%), Immigrants from Caribbean (84.0%, a difference of 0.020%), and Celtic (84.1%, a difference of 0.030%).
| Demographics | Rating | Rank | In Labor Force | Age 30-34 |
| Haitians | 1.8 /100 | #234 | Tragic 84.1% |
| French American Indians | 1.7 /100 | #235 | Tragic 84.1% |
| U.S. Virgin Islanders | 1.5 /100 | #236 | Tragic 84.1% |
| Celtics | 1.4 /100 | #237 | Tragic 84.1% |
| Immigrants | Barbados | 1.4 /100 | #238 | Tragic 84.0% |
| English | 1.4 /100 | #239 | Tragic 84.0% |
| Venezuelans | 1.3 /100 | #240 | Tragic 84.0% |
| Immigrants | Portugal | 1.2 /100 | #241 | Tragic 84.0% |
| Immigrants | Oceania | 1.1 /100 | #242 | Tragic 84.0% |
| Immigrants | Caribbean | 1.1 /100 | #243 | Tragic 84.0% |
| Basques | 0.9 /100 | #244 | Tragic 84.0% |
| Immigrants | Venezuela | 0.9 /100 | #245 | Tragic 84.0% |
| Central Americans | 0.9 /100 | #246 | Tragic 84.0% |
| British West Indians | 0.8 /100 | #247 | Tragic 84.0% |
| Portuguese | 0.8 /100 | #248 | Tragic 84.0% |
Demographics Similar to Immigrants from Turkey by In Labor Force | Age 30-34
In terms of in labor force | age 30-34, the demographic groups most similar to Immigrants from Turkey are Immigrants from Kenya (85.5%, a difference of 0.0%), Czech (85.5%, a difference of 0.010%), Russian (85.5%, a difference of 0.010%), Polish (85.5%, a difference of 0.010%), and Filipino (85.5%, a difference of 0.020%).
| Demographics | Rating | Rank | In Labor Force | Age 30-34 |
| Immigrants | Sweden | 99.8 /100 | #48 | Exceptional 85.6% |
| Lithuanians | 99.8 /100 | #49 | Exceptional 85.6% |
| Immigrants | Australia | 99.8 /100 | #50 | Exceptional 85.6% |
| Cape Verdeans | 99.7 /100 | #51 | Exceptional 85.6% |
| Slovenes | 99.7 /100 | #52 | Exceptional 85.6% |
| Filipinos | 99.6 /100 | #53 | Exceptional 85.5% |
| Immigrants | Kenya | 99.6 /100 | #54 | Exceptional 85.5% |
| Immigrants | Turkey | 99.6 /100 | #55 | Exceptional 85.5% |
| Czechs | 99.6 /100 | #56 | Exceptional 85.5% |
| Russians | 99.6 /100 | #57 | Exceptional 85.5% |
| Poles | 99.6 /100 | #58 | Exceptional 85.5% |
| Immigrants | Poland | 99.5 /100 | #59 | Exceptional 85.5% |
| Immigrants | France | 99.5 /100 | #60 | Exceptional 85.5% |
| Immigrants | Brazil | 99.5 /100 | #61 | Exceptional 85.5% |
| Soviet Union | 99.4 /100 | #62 | Exceptional 85.5% |