Hispanic or Latino vs Okinawan In Labor Force | Age > 16
COMPARE
Hispanic or Latino
Okinawan
In Labor Force | Age > 16
In Labor Force | Age > 16 Comparison
Hispanics or Latinos
Okinawans
64.3%
IN LABOR FORCE | AGE > 16
1.1/ 100
METRIC RATING
255th/ 347
METRIC RANK
65.9%
IN LABOR FORCE | AGE > 16
98.7/ 100
METRIC RATING
100th/ 347
METRIC RANK
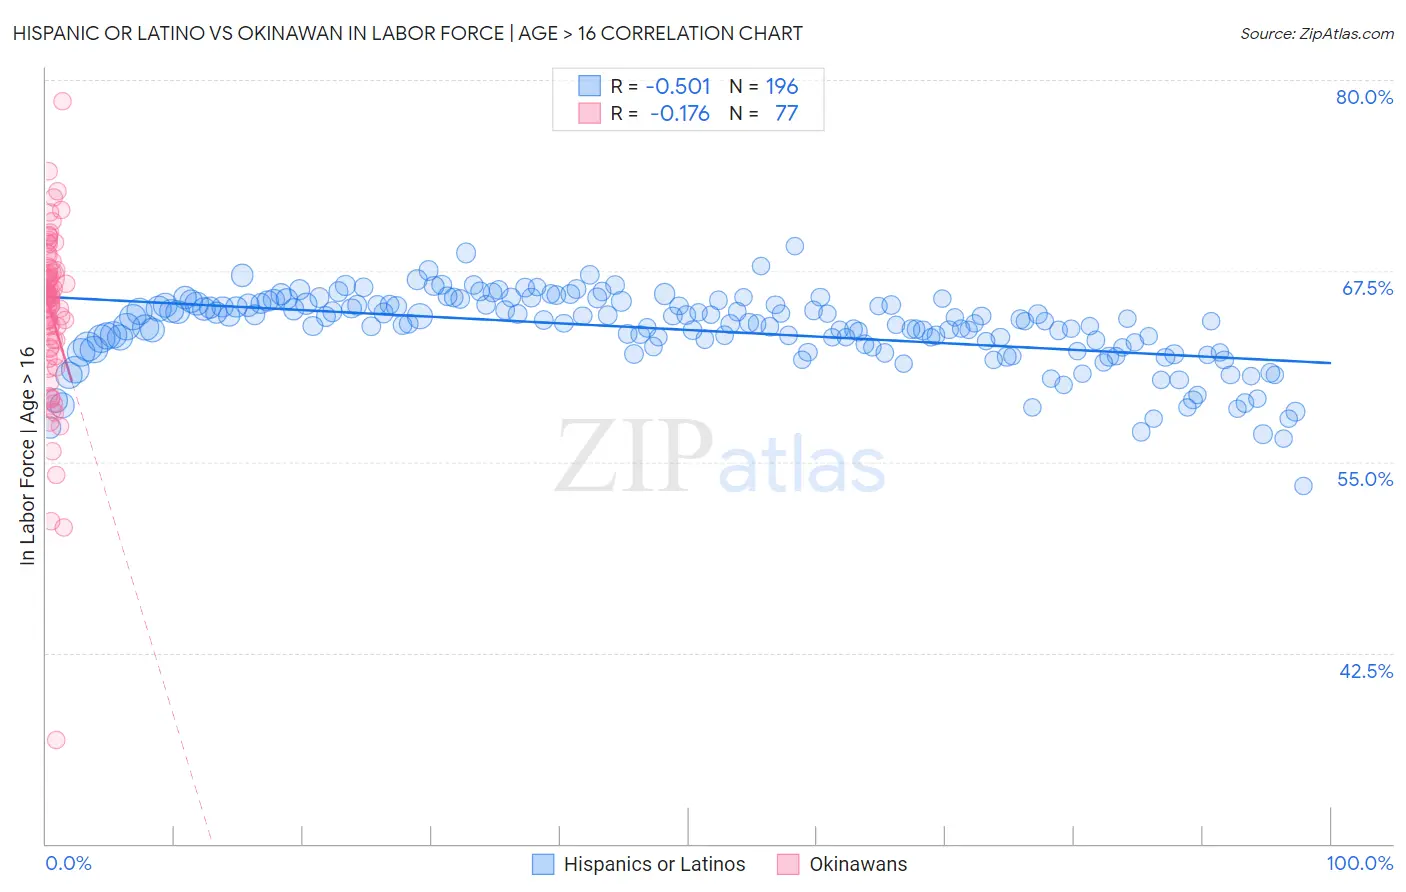
Hispanic or Latino vs Okinawan In Labor Force | Age > 16 Correlation Chart
The statistical analysis conducted on geographies consisting of 574,025,710 people shows a substantial negative correlation between the proportion of Hispanics or Latinos and labor force participation rate among population ages 16 and over in the United States with a correlation coefficient (R) of -0.501 and weighted average of 64.3%. Similarly, the statistical analysis conducted on geographies consisting of 73,766,468 people shows a poor negative correlation between the proportion of Okinawans and labor force participation rate among population ages 16 and over in the United States with a correlation coefficient (R) of -0.176 and weighted average of 65.9%, a difference of 2.5%.
In Labor Force | Age > 16 Correlation Summary
| Measurement | Hispanic or Latino | Okinawan |
| Minimum | 53.4% | 36.8% |
| Maximum | 69.1% | 78.6% |
| Range | 15.7% | 41.8% |
| Mean | 63.7% | 64.6% |
| Median | 64.1% | 65.7% |
| Interquartile 25% (IQ1) | 62.5% | 62.5% |
| Interquartile 75% (IQ3) | 65.3% | 67.5% |
| Interquartile Range (IQR) | 2.8% | 5.0% |
| Standard Deviation (Sample) | 2.5% | 5.8% |
| Standard Deviation (Population) | 2.5% | 5.8% |
Similar Demographics by In Labor Force | Age > 16
Demographics Similar to Hispanics or Latinos by In Labor Force | Age > 16
In terms of in labor force | age > 16, the demographic groups most similar to Hispanics or Latinos are Immigrants from Mexico (64.3%, a difference of 0.040%), Immigrants from Uzbekistan (64.3%, a difference of 0.070%), Immigrants from Dominican Republic (64.4%, a difference of 0.080%), Czechoslovakian (64.3%, a difference of 0.080%), and Inupiat (64.3%, a difference of 0.080%).
| Demographics | Rating | Rank | In Labor Force | Age > 16 |
| Immigrants | Barbados | 2.1 /100 | #248 | Tragic 64.4% |
| Germans | 1.8 /100 | #249 | Tragic 64.4% |
| British West Indians | 1.8 /100 | #250 | Tragic 64.4% |
| Portuguese | 1.6 /100 | #251 | Tragic 64.4% |
| Immigrants | Dominican Republic | 1.5 /100 | #252 | Tragic 64.4% |
| Czechoslovakians | 1.4 /100 | #253 | Tragic 64.3% |
| Immigrants | Uzbekistan | 1.4 /100 | #254 | Tragic 64.3% |
| Hispanics or Latinos | 1.1 /100 | #255 | Tragic 64.3% |
| Immigrants | Mexico | 1.0 /100 | #256 | Tragic 64.3% |
| Inupiat | 0.8 /100 | #257 | Tragic 64.3% |
| Immigrants | Scotland | 0.8 /100 | #258 | Tragic 64.2% |
| Immigrants | Western Europe | 0.7 /100 | #259 | Tragic 64.2% |
| Marshallese | 0.7 /100 | #260 | Tragic 64.2% |
| Basques | 0.7 /100 | #261 | Tragic 64.2% |
| Finns | 0.7 /100 | #262 | Tragic 64.2% |
Demographics Similar to Okinawans by In Labor Force | Age > 16
In terms of in labor force | age > 16, the demographic groups most similar to Okinawans are Immigrants from Australia (65.9%, a difference of 0.0%), Immigrants from Colombia (65.9%, a difference of 0.010%), Uruguayan (65.9%, a difference of 0.010%), Immigrants from Chile (65.9%, a difference of 0.020%), and Immigrants from South Eastern Asia (65.9%, a difference of 0.030%).
| Demographics | Rating | Rank | In Labor Force | Age > 16 |
| Immigrants | South America | 99.1 /100 | #93 | Exceptional 66.0% |
| Immigrants | Cambodia | 99.1 /100 | #94 | Exceptional 66.0% |
| Immigrants | Uruguay | 99.1 /100 | #95 | Exceptional 66.0% |
| Bangladeshis | 98.9 /100 | #96 | Exceptional 65.9% |
| Filipinos | 98.9 /100 | #97 | Exceptional 65.9% |
| Immigrants | Chile | 98.7 /100 | #98 | Exceptional 65.9% |
| Immigrants | Australia | 98.7 /100 | #99 | Exceptional 65.9% |
| Okinawans | 98.7 /100 | #100 | Exceptional 65.9% |
| Immigrants | Colombia | 98.6 /100 | #101 | Exceptional 65.9% |
| Uruguayans | 98.6 /100 | #102 | Exceptional 65.9% |
| Immigrants | South Eastern Asia | 98.5 /100 | #103 | Exceptional 65.9% |
| Palestinians | 98.5 /100 | #104 | Exceptional 65.9% |
| Colombians | 98.4 /100 | #105 | Exceptional 65.9% |
| Immigrants | Serbia | 98.1 /100 | #106 | Exceptional 65.8% |
| Immigrants | Poland | 98.1 /100 | #107 | Exceptional 65.8% |