Slovene vs Scotch-Irish In Labor Force | Age 30-34
COMPARE
Slovene
Scotch-Irish
In Labor Force | Age 30-34
In Labor Force | Age 30-34 Comparison
Slovenes
Scotch-Irish
85.6%
IN LABOR FORCE | AGE 30-34
99.7/ 100
METRIC RATING
52nd/ 347
METRIC RANK
83.8%
IN LABOR FORCE | AGE 30-34
0.3/ 100
METRIC RATING
259th/ 347
METRIC RANK
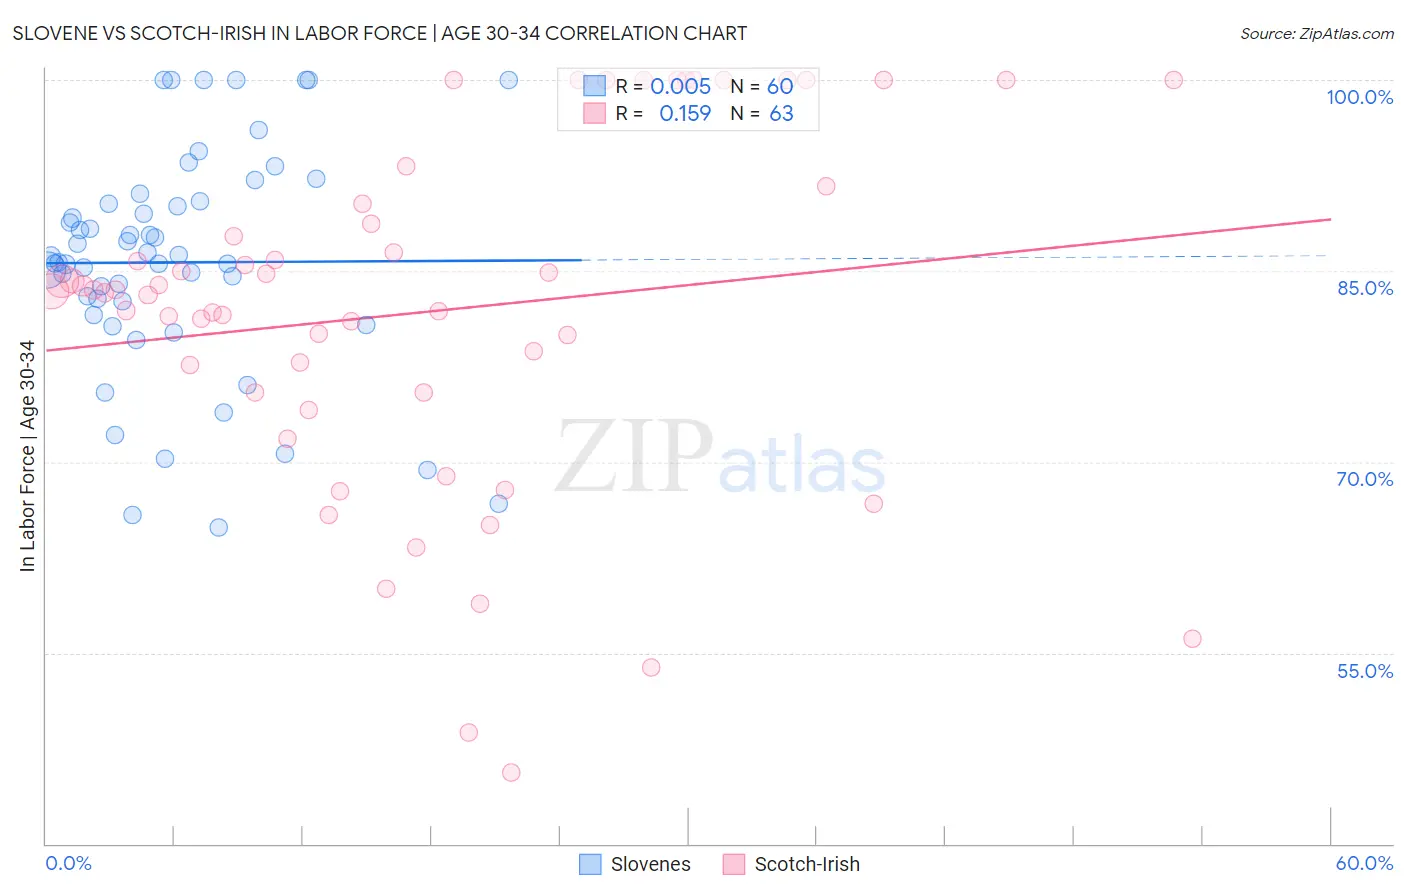
Slovene vs Scotch-Irish In Labor Force | Age 30-34 Correlation Chart
The statistical analysis conducted on geographies consisting of 261,230,340 people shows no correlation between the proportion of Slovenes and labor force participation rate among population between the ages 30 and 34 in the United States with a correlation coefficient (R) of 0.005 and weighted average of 85.6%. Similarly, the statistical analysis conducted on geographies consisting of 547,840,713 people shows a poor positive correlation between the proportion of Scotch-Irish and labor force participation rate among population between the ages 30 and 34 in the United States with a correlation coefficient (R) of 0.159 and weighted average of 83.8%, a difference of 2.1%.
In Labor Force | Age 30-34 Correlation Summary
| Measurement | Slovene | Scotch-Irish |
| Minimum | 64.8% | 45.6% |
| Maximum | 100.0% | 100.0% |
| Range | 35.2% | 54.4% |
| Mean | 85.7% | 81.8% |
| Median | 85.9% | 83.4% |
| Interquartile 25% (IQ1) | 82.1% | 75.4% |
| Interquartile 75% (IQ3) | 90.4% | 90.3% |
| Interquartile Range (IQR) | 8.3% | 14.8% |
| Standard Deviation (Sample) | 8.8% | 13.7% |
| Standard Deviation (Population) | 8.8% | 13.6% |
Similar Demographics by In Labor Force | Age 30-34
Demographics Similar to Slovenes by In Labor Force | Age 30-34
In terms of in labor force | age 30-34, the demographic groups most similar to Slovenes are Cape Verdean (85.6%, a difference of 0.010%), Immigrants from Australia (85.6%, a difference of 0.030%), Immigrants from Sweden (85.6%, a difference of 0.040%), Lithuanian (85.6%, a difference of 0.040%), and Filipino (85.5%, a difference of 0.050%).
| Demographics | Rating | Rank | In Labor Force | Age 30-34 |
| Immigrants | Nepal | 99.8 /100 | #45 | Exceptional 85.6% |
| Immigrants | Morocco | 99.8 /100 | #46 | Exceptional 85.6% |
| Croatians | 99.8 /100 | #47 | Exceptional 85.6% |
| Immigrants | Sweden | 99.8 /100 | #48 | Exceptional 85.6% |
| Lithuanians | 99.8 /100 | #49 | Exceptional 85.6% |
| Immigrants | Australia | 99.8 /100 | #50 | Exceptional 85.6% |
| Cape Verdeans | 99.7 /100 | #51 | Exceptional 85.6% |
| Slovenes | 99.7 /100 | #52 | Exceptional 85.6% |
| Filipinos | 99.6 /100 | #53 | Exceptional 85.5% |
| Immigrants | Kenya | 99.6 /100 | #54 | Exceptional 85.5% |
| Immigrants | Turkey | 99.6 /100 | #55 | Exceptional 85.5% |
| Czechs | 99.6 /100 | #56 | Exceptional 85.5% |
| Russians | 99.6 /100 | #57 | Exceptional 85.5% |
| Poles | 99.6 /100 | #58 | Exceptional 85.5% |
| Immigrants | Poland | 99.5 /100 | #59 | Exceptional 85.5% |
Demographics Similar to Scotch-Irish by In Labor Force | Age 30-34
In terms of in labor force | age 30-34, the demographic groups most similar to Scotch-Irish are Honduran (83.8%, a difference of 0.0%), Immigrants from Dominican Republic (83.8%, a difference of 0.020%), Guyanese (83.8%, a difference of 0.020%), Iraqi (83.8%, a difference of 0.030%), and Dominican (83.8%, a difference of 0.040%).
| Demographics | Rating | Rank | In Labor Force | Age 30-34 |
| Bahamians | 0.6 /100 | #252 | Tragic 83.9% |
| Immigrants | Nicaragua | 0.6 /100 | #253 | Tragic 83.9% |
| Immigrants | St. Vincent and the Grenadines | 0.5 /100 | #254 | Tragic 83.9% |
| Whites/Caucasians | 0.5 /100 | #255 | Tragic 83.9% |
| Immigrants | Lebanon | 0.4 /100 | #256 | Tragic 83.9% |
| Iraqis | 0.3 /100 | #257 | Tragic 83.8% |
| Hondurans | 0.3 /100 | #258 | Tragic 83.8% |
| Scotch-Irish | 0.3 /100 | #259 | Tragic 83.8% |
| Immigrants | Dominican Republic | 0.3 /100 | #260 | Tragic 83.8% |
| Guyanese | 0.3 /100 | #261 | Tragic 83.8% |
| Dominicans | 0.2 /100 | #262 | Tragic 83.8% |
| Immigrants | Guyana | 0.2 /100 | #263 | Tragic 83.8% |
| Guatemalans | 0.2 /100 | #264 | Tragic 83.7% |
| Immigrants | Honduras | 0.1 /100 | #265 | Tragic 83.7% |
| Immigrants | Guatemala | 0.1 /100 | #266 | Tragic 83.7% |