Estonian vs Immigrants from Ecuador In Labor Force | Age 16-19
COMPARE
Estonian
Immigrants from Ecuador
In Labor Force | Age 16-19
In Labor Force | Age 16-19 Comparison
Estonians
Immigrants from Ecuador
37.7%
IN LABOR FORCE | AGE 16-19
91.7/ 100
METRIC RATING
140th/ 347
METRIC RANK
31.0%
IN LABOR FORCE | AGE 16-19
0.0/ 100
METRIC RATING
328th/ 347
METRIC RANK
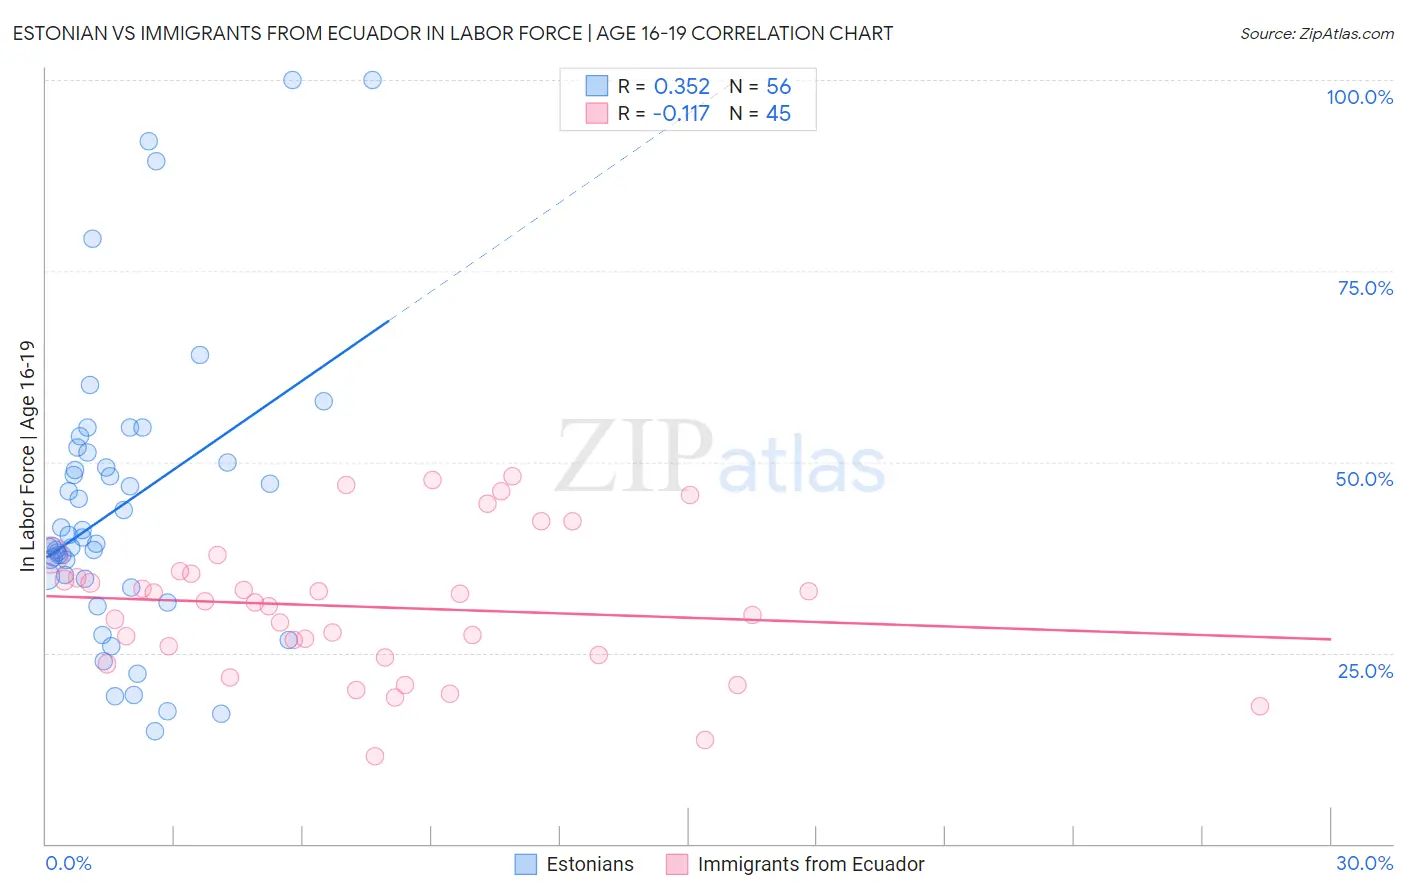
Estonian vs Immigrants from Ecuador In Labor Force | Age 16-19 Correlation Chart
The statistical analysis conducted on geographies consisting of 123,400,045 people shows a mild positive correlation between the proportion of Estonians and labor force participation rate among population between the ages 16 and 19 in the United States with a correlation coefficient (R) of 0.352 and weighted average of 37.7%. Similarly, the statistical analysis conducted on geographies consisting of 270,745,839 people shows a poor negative correlation between the proportion of Immigrants from Ecuador and labor force participation rate among population between the ages 16 and 19 in the United States with a correlation coefficient (R) of -0.117 and weighted average of 31.0%, a difference of 21.4%.
In Labor Force | Age 16-19 Correlation Summary
| Measurement | Estonian | Immigrants from Ecuador |
| Minimum | 14.8% | 11.4% |
| Maximum | 100.0% | 48.1% |
| Range | 85.2% | 36.7% |
| Mean | 44.2% | 31.0% |
| Median | 39.7% | 31.6% |
| Interquartile 25% (IQ1) | 34.9% | 24.5% |
| Interquartile 75% (IQ3) | 50.6% | 35.6% |
| Interquartile Range (IQR) | 15.8% | 11.1% |
| Standard Deviation (Sample) | 19.0% | 9.2% |
| Standard Deviation (Population) | 18.8% | 9.1% |
Similar Demographics by In Labor Force | Age 16-19
Demographics Similar to Estonians by In Labor Force | Age 16-19
In terms of in labor force | age 16-19, the demographic groups most similar to Estonians are Immigrants from Moldova (37.7%, a difference of 0.030%), Comanche (37.7%, a difference of 0.050%), Syrian (37.6%, a difference of 0.14%), Cajun (37.8%, a difference of 0.27%), and Australian (37.8%, a difference of 0.28%).
| Demographics | Rating | Rank | In Labor Force | Age 16-19 |
| Cheyenne | 94.6 /100 | #133 | Exceptional 37.9% |
| Immigrants | Netherlands | 93.7 /100 | #134 | Exceptional 37.8% |
| Macedonians | 93.4 /100 | #135 | Exceptional 37.8% |
| Australians | 93.2 /100 | #136 | Exceptional 37.8% |
| Cajuns | 93.2 /100 | #137 | Exceptional 37.8% |
| Comanche | 91.9 /100 | #138 | Exceptional 37.7% |
| Immigrants | Moldova | 91.9 /100 | #139 | Exceptional 37.7% |
| Estonians | 91.7 /100 | #140 | Exceptional 37.7% |
| Syrians | 90.7 /100 | #141 | Exceptional 37.6% |
| Sierra Leoneans | 89.7 /100 | #142 | Excellent 37.6% |
| Pakistanis | 89.5 /100 | #143 | Excellent 37.6% |
| Japanese | 89.3 /100 | #144 | Excellent 37.5% |
| Paiute | 89.3 /100 | #145 | Excellent 37.5% |
| Immigrants | Western Europe | 88.9 /100 | #146 | Excellent 37.5% |
| Brazilians | 88.7 /100 | #147 | Excellent 37.5% |
Demographics Similar to Immigrants from Ecuador by In Labor Force | Age 16-19
In terms of in labor force | age 16-19, the demographic groups most similar to Immigrants from Ecuador are Barbadian (31.0%, a difference of 0.030%), Immigrants from Taiwan (31.0%, a difference of 0.040%), Lumbee (31.0%, a difference of 0.15%), Immigrants from Dominican Republic (31.1%, a difference of 0.20%), and Trinidadian and Tobagonian (30.9%, a difference of 0.30%).
| Demographics | Rating | Rank | In Labor Force | Age 16-19 |
| West Indians | 0.0 /100 | #321 | Tragic 31.3% |
| Tohono O'odham | 0.0 /100 | #322 | Tragic 31.3% |
| Immigrants | Caribbean | 0.0 /100 | #323 | Tragic 31.2% |
| Dominicans | 0.0 /100 | #324 | Tragic 31.2% |
| Immigrants | China | 0.0 /100 | #325 | Tragic 31.1% |
| Immigrants | Dominican Republic | 0.0 /100 | #326 | Tragic 31.1% |
| Immigrants | Taiwan | 0.0 /100 | #327 | Tragic 31.0% |
| Immigrants | Ecuador | 0.0 /100 | #328 | Tragic 31.0% |
| Barbadians | 0.0 /100 | #329 | Tragic 31.0% |
| Lumbee | 0.0 /100 | #330 | Tragic 31.0% |
| Trinidadians and Tobagonians | 0.0 /100 | #331 | Tragic 30.9% |
| Immigrants | Israel | 0.0 /100 | #332 | Tragic 30.5% |
| Immigrants | Hong Kong | 0.0 /100 | #333 | Tragic 30.5% |
| Puerto Ricans | 0.0 /100 | #334 | Tragic 30.3% |
| Immigrants | Cuba | 0.0 /100 | #335 | Tragic 30.2% |