Immigrants from Central America vs Immigrants from Ecuador In Labor Force | Age 16-19
COMPARE
Immigrants from Central America
Immigrants from Ecuador
In Labor Force | Age 16-19
In Labor Force | Age 16-19 Comparison
Immigrants from Central America
Immigrants from Ecuador
35.0%
IN LABOR FORCE | AGE 16-19
3.0/ 100
METRIC RATING
240th/ 347
METRIC RANK
31.0%
IN LABOR FORCE | AGE 16-19
0.0/ 100
METRIC RATING
328th/ 347
METRIC RANK
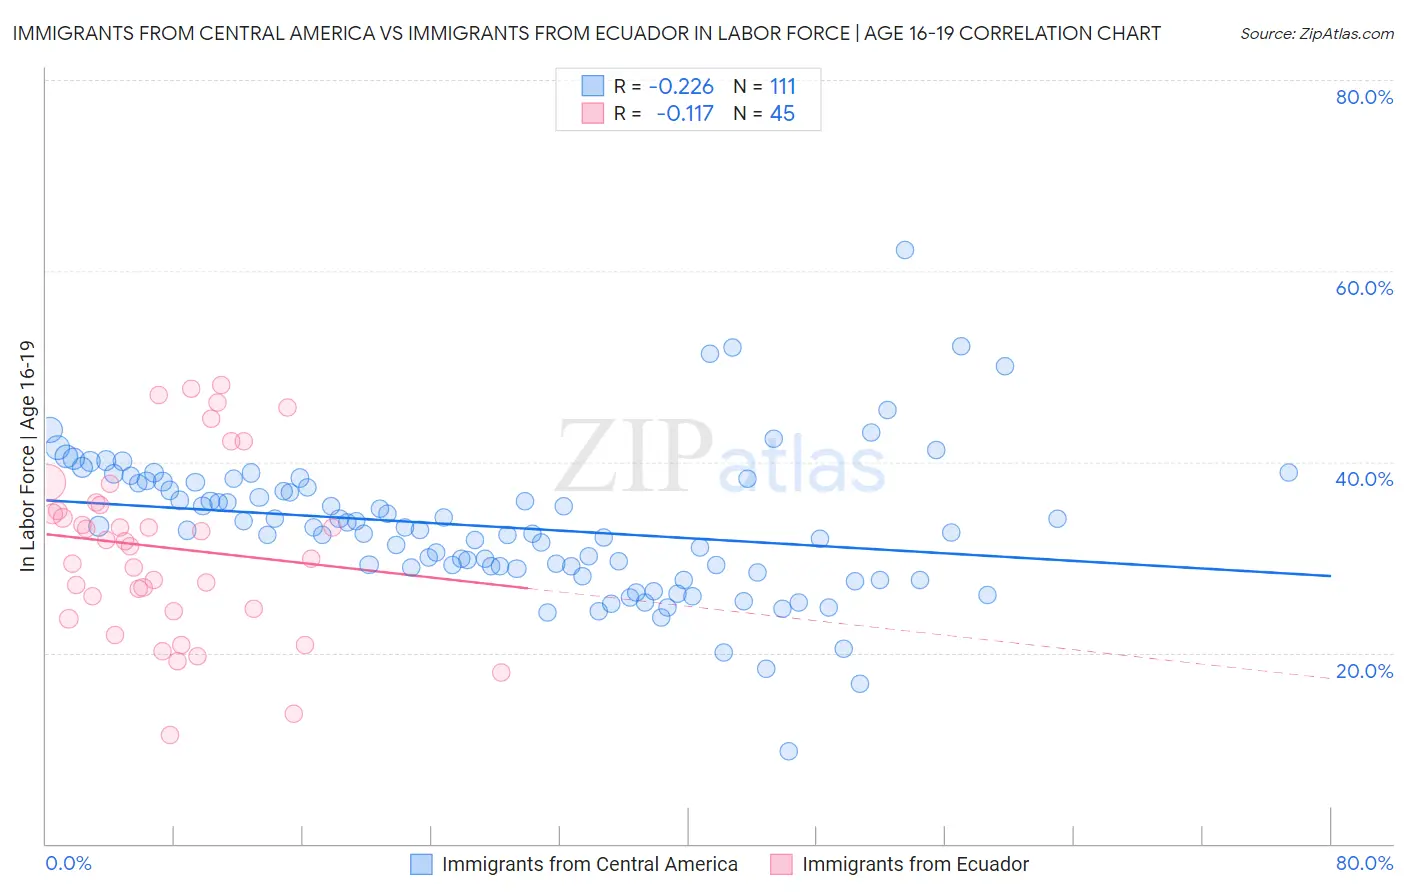
Immigrants from Central America vs Immigrants from Ecuador In Labor Force | Age 16-19 Correlation Chart
The statistical analysis conducted on geographies consisting of 534,055,190 people shows a weak negative correlation between the proportion of Immigrants from Central America and labor force participation rate among population between the ages 16 and 19 in the United States with a correlation coefficient (R) of -0.226 and weighted average of 35.0%. Similarly, the statistical analysis conducted on geographies consisting of 270,745,839 people shows a poor negative correlation between the proportion of Immigrants from Ecuador and labor force participation rate among population between the ages 16 and 19 in the United States with a correlation coefficient (R) of -0.117 and weighted average of 31.0%, a difference of 12.7%.
In Labor Force | Age 16-19 Correlation Summary
| Measurement | Immigrants from Central America | Immigrants from Ecuador |
| Minimum | 9.7% | 11.4% |
| Maximum | 62.2% | 48.1% |
| Range | 52.5% | 36.7% |
| Mean | 33.2% | 31.0% |
| Median | 32.8% | 31.6% |
| Interquartile 25% (IQ1) | 28.8% | 24.5% |
| Interquartile 75% (IQ3) | 37.9% | 35.6% |
| Interquartile Range (IQR) | 9.1% | 11.1% |
| Standard Deviation (Sample) | 7.6% | 9.2% |
| Standard Deviation (Population) | 7.5% | 9.1% |
Similar Demographics by In Labor Force | Age 16-19
Demographics Similar to Immigrants from Central America by In Labor Force | Age 16-19
In terms of in labor force | age 16-19, the demographic groups most similar to Immigrants from Central America are Immigrants from Ireland (35.0%, a difference of 0.030%), Inupiat (35.0%, a difference of 0.10%), Uruguayan (34.9%, a difference of 0.15%), Pueblo (34.9%, a difference of 0.18%), and Immigrants from Vietnam (35.0%, a difference of 0.19%).
| Demographics | Rating | Rank | In Labor Force | Age 16-19 |
| Immigrants | France | 4.3 /100 | #233 | Tragic 35.1% |
| Immigrants | Mexico | 4.2 /100 | #234 | Tragic 35.1% |
| Immigrants | Philippines | 4.0 /100 | #235 | Tragic 35.1% |
| Immigrants | Australia | 3.6 /100 | #236 | Tragic 35.1% |
| Immigrants | India | 3.5 /100 | #237 | Tragic 35.0% |
| Immigrants | Vietnam | 3.4 /100 | #238 | Tragic 35.0% |
| Inupiat | 3.2 /100 | #239 | Tragic 35.0% |
| Immigrants | Central America | 3.0 /100 | #240 | Tragic 35.0% |
| Immigrants | Ireland | 2.9 /100 | #241 | Tragic 35.0% |
| Uruguayans | 2.6 /100 | #242 | Tragic 34.9% |
| Pueblo | 2.6 /100 | #243 | Tragic 34.9% |
| Immigrants | Turkey | 2.6 /100 | #244 | Tragic 34.9% |
| Immigrants | Greece | 2.4 /100 | #245 | Tragic 34.9% |
| Immigrants | Sri Lanka | 2.4 /100 | #246 | Tragic 34.9% |
| Laotians | 2.4 /100 | #247 | Tragic 34.9% |
Demographics Similar to Immigrants from Ecuador by In Labor Force | Age 16-19
In terms of in labor force | age 16-19, the demographic groups most similar to Immigrants from Ecuador are Barbadian (31.0%, a difference of 0.030%), Immigrants from Taiwan (31.0%, a difference of 0.040%), Lumbee (31.0%, a difference of 0.15%), Immigrants from Dominican Republic (31.1%, a difference of 0.20%), and Trinidadian and Tobagonian (30.9%, a difference of 0.30%).
| Demographics | Rating | Rank | In Labor Force | Age 16-19 |
| West Indians | 0.0 /100 | #321 | Tragic 31.3% |
| Tohono O'odham | 0.0 /100 | #322 | Tragic 31.3% |
| Immigrants | Caribbean | 0.0 /100 | #323 | Tragic 31.2% |
| Dominicans | 0.0 /100 | #324 | Tragic 31.2% |
| Immigrants | China | 0.0 /100 | #325 | Tragic 31.1% |
| Immigrants | Dominican Republic | 0.0 /100 | #326 | Tragic 31.1% |
| Immigrants | Taiwan | 0.0 /100 | #327 | Tragic 31.0% |
| Immigrants | Ecuador | 0.0 /100 | #328 | Tragic 31.0% |
| Barbadians | 0.0 /100 | #329 | Tragic 31.0% |
| Lumbee | 0.0 /100 | #330 | Tragic 31.0% |
| Trinidadians and Tobagonians | 0.0 /100 | #331 | Tragic 30.9% |
| Immigrants | Israel | 0.0 /100 | #332 | Tragic 30.5% |
| Immigrants | Hong Kong | 0.0 /100 | #333 | Tragic 30.5% |
| Puerto Ricans | 0.0 /100 | #334 | Tragic 30.3% |
| Immigrants | Cuba | 0.0 /100 | #335 | Tragic 30.2% |