Immigrants from Lithuania vs Immigrants from Ecuador In Labor Force | Age 16-19
COMPARE
Immigrants from Lithuania
Immigrants from Ecuador
In Labor Force | Age 16-19
In Labor Force | Age 16-19 Comparison
Immigrants from Lithuania
Immigrants from Ecuador
37.2%
IN LABOR FORCE | AGE 16-19
80.7/ 100
METRIC RATING
155th/ 347
METRIC RANK
31.0%
IN LABOR FORCE | AGE 16-19
0.0/ 100
METRIC RATING
328th/ 347
METRIC RANK
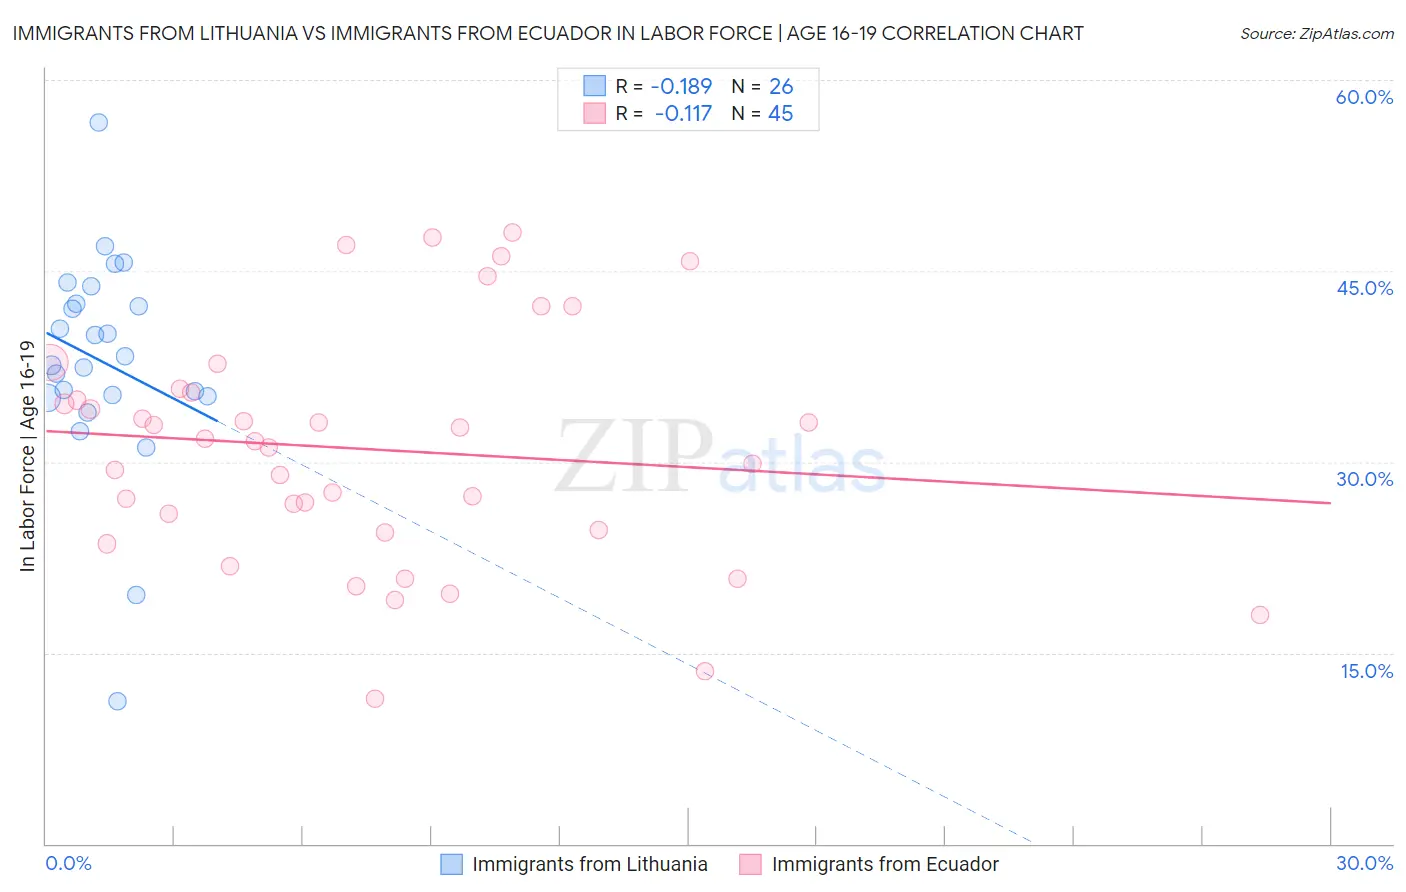
Immigrants from Lithuania vs Immigrants from Ecuador In Labor Force | Age 16-19 Correlation Chart
The statistical analysis conducted on geographies consisting of 117,641,154 people shows a poor negative correlation between the proportion of Immigrants from Lithuania and labor force participation rate among population between the ages 16 and 19 in the United States with a correlation coefficient (R) of -0.189 and weighted average of 37.2%. Similarly, the statistical analysis conducted on geographies consisting of 270,745,839 people shows a poor negative correlation between the proportion of Immigrants from Ecuador and labor force participation rate among population between the ages 16 and 19 in the United States with a correlation coefficient (R) of -0.117 and weighted average of 31.0%, a difference of 20.0%.
In Labor Force | Age 16-19 Correlation Summary
| Measurement | Immigrants from Lithuania | Immigrants from Ecuador |
| Minimum | 11.2% | 11.4% |
| Maximum | 56.7% | 48.1% |
| Range | 45.5% | 36.7% |
| Mean | 37.9% | 31.0% |
| Median | 37.9% | 31.6% |
| Interquartile 25% (IQ1) | 35.1% | 24.5% |
| Interquartile 75% (IQ3) | 42.5% | 35.6% |
| Interquartile Range (IQR) | 7.3% | 11.1% |
| Standard Deviation (Sample) | 8.7% | 9.2% |
| Standard Deviation (Population) | 8.5% | 9.1% |
Similar Demographics by In Labor Force | Age 16-19
Demographics Similar to Immigrants from Lithuania by In Labor Force | Age 16-19
In terms of in labor force | age 16-19, the demographic groups most similar to Immigrants from Lithuania are Kiowa (37.2%, a difference of 0.020%), Immigrants from Bulgaria (37.3%, a difference of 0.070%), Arapaho (37.3%, a difference of 0.090%), Immigrants from Sierra Leone (37.3%, a difference of 0.25%), and Immigrants from Brazil (37.1%, a difference of 0.31%).
| Demographics | Rating | Rank | In Labor Force | Age 16-19 |
| Romanians | 87.3 /100 | #148 | Excellent 37.5% |
| Native Hawaiians | 85.0 /100 | #149 | Excellent 37.4% |
| Tsimshian | 84.7 /100 | #150 | Excellent 37.4% |
| Immigrants | Poland | 84.4 /100 | #151 | Excellent 37.3% |
| Immigrants | Sierra Leone | 83.6 /100 | #152 | Excellent 37.3% |
| Arapaho | 81.8 /100 | #153 | Excellent 37.3% |
| Immigrants | Bulgaria | 81.6 /100 | #154 | Excellent 37.3% |
| Immigrants | Lithuania | 80.7 /100 | #155 | Excellent 37.2% |
| Kiowa | 80.4 /100 | #156 | Excellent 37.2% |
| Immigrants | Brazil | 76.5 /100 | #157 | Good 37.1% |
| Ute | 75.7 /100 | #158 | Good 37.1% |
| Yaqui | 74.4 /100 | #159 | Good 37.1% |
| Immigrants | Saudi Arabia | 73.9 /100 | #160 | Good 37.0% |
| Cambodians | 71.5 /100 | #161 | Good 37.0% |
| Immigrants | Jordan | 69.5 /100 | #162 | Good 36.9% |
Demographics Similar to Immigrants from Ecuador by In Labor Force | Age 16-19
In terms of in labor force | age 16-19, the demographic groups most similar to Immigrants from Ecuador are Barbadian (31.0%, a difference of 0.030%), Immigrants from Taiwan (31.0%, a difference of 0.040%), Lumbee (31.0%, a difference of 0.15%), Immigrants from Dominican Republic (31.1%, a difference of 0.20%), and Trinidadian and Tobagonian (30.9%, a difference of 0.30%).
| Demographics | Rating | Rank | In Labor Force | Age 16-19 |
| West Indians | 0.0 /100 | #321 | Tragic 31.3% |
| Tohono O'odham | 0.0 /100 | #322 | Tragic 31.3% |
| Immigrants | Caribbean | 0.0 /100 | #323 | Tragic 31.2% |
| Dominicans | 0.0 /100 | #324 | Tragic 31.2% |
| Immigrants | China | 0.0 /100 | #325 | Tragic 31.1% |
| Immigrants | Dominican Republic | 0.0 /100 | #326 | Tragic 31.1% |
| Immigrants | Taiwan | 0.0 /100 | #327 | Tragic 31.0% |
| Immigrants | Ecuador | 0.0 /100 | #328 | Tragic 31.0% |
| Barbadians | 0.0 /100 | #329 | Tragic 31.0% |
| Lumbee | 0.0 /100 | #330 | Tragic 31.0% |
| Trinidadians and Tobagonians | 0.0 /100 | #331 | Tragic 30.9% |
| Immigrants | Israel | 0.0 /100 | #332 | Tragic 30.5% |
| Immigrants | Hong Kong | 0.0 /100 | #333 | Tragic 30.5% |
| Puerto Ricans | 0.0 /100 | #334 | Tragic 30.3% |
| Immigrants | Cuba | 0.0 /100 | #335 | Tragic 30.2% |