Immigrants from Peru vs Immigrants from Guatemala In Labor Force | Age 25-29
COMPARE
Immigrants from Peru
Immigrants from Guatemala
In Labor Force | Age 25-29
In Labor Force | Age 25-29 Comparison
Immigrants from Peru
Immigrants from Guatemala
84.7%
IN LABOR FORCE | AGE 25-29
58.6/ 100
METRIC RATING
160th/ 347
METRIC RANK
83.6%
IN LABOR FORCE | AGE 25-29
0.1/ 100
METRIC RATING
258th/ 347
METRIC RANK
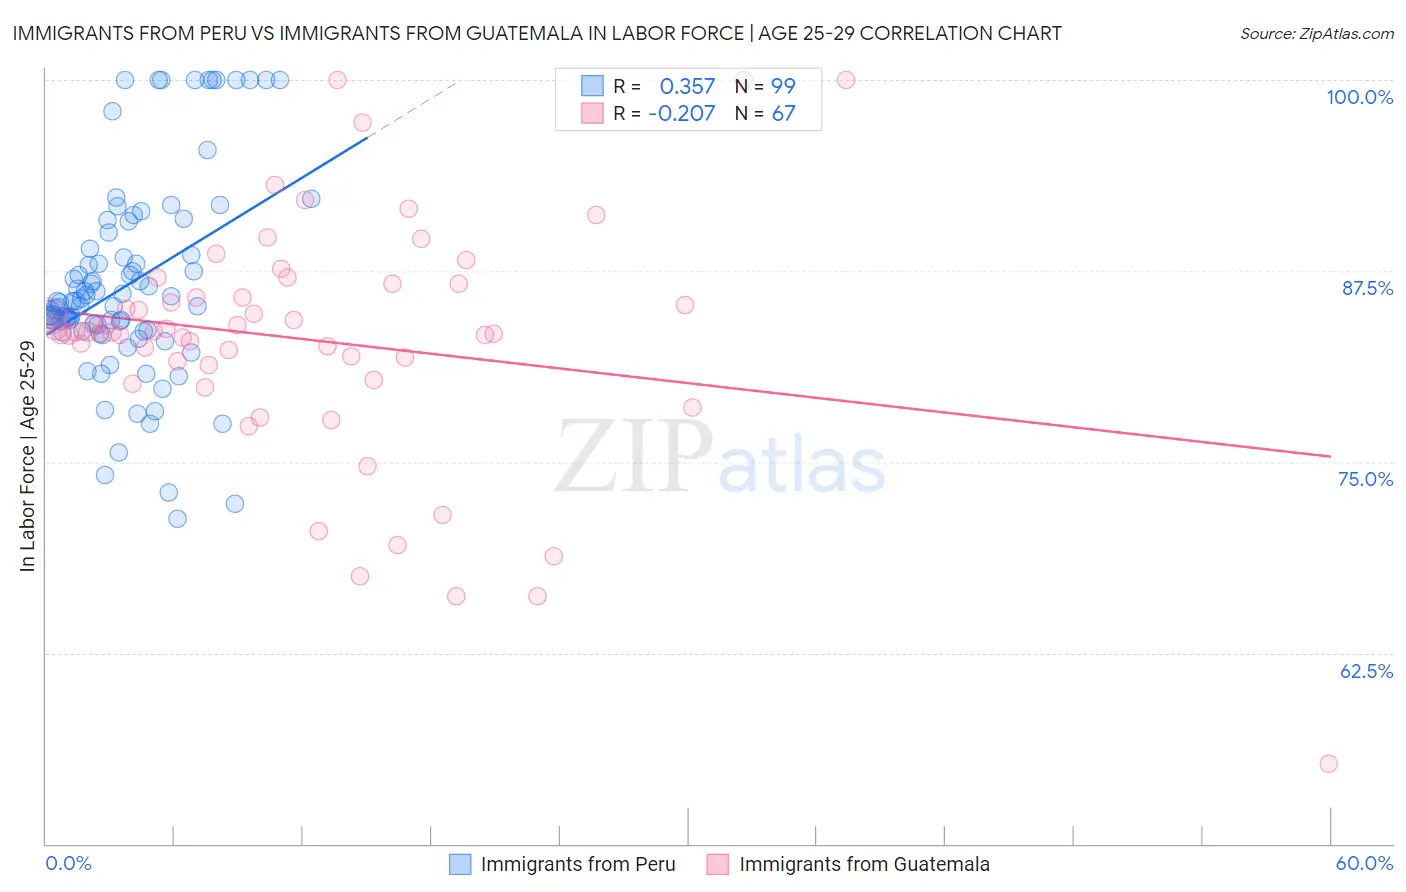
Immigrants from Peru vs Immigrants from Guatemala In Labor Force | Age 25-29 Correlation Chart
The statistical analysis conducted on geographies consisting of 328,804,667 people shows a mild positive correlation between the proportion of Immigrants from Peru and labor force participation rate among population between the ages 25 and 29 in the United States with a correlation coefficient (R) of 0.357 and weighted average of 84.7%. Similarly, the statistical analysis conducted on geographies consisting of 377,188,709 people shows a weak negative correlation between the proportion of Immigrants from Guatemala and labor force participation rate among population between the ages 25 and 29 in the United States with a correlation coefficient (R) of -0.207 and weighted average of 83.6%, a difference of 1.3%.
In Labor Force | Age 25-29 Correlation Summary
| Measurement | Immigrants from Peru | Immigrants from Guatemala |
| Minimum | 71.3% | 55.2% |
| Maximum | 100.0% | 100.0% |
| Range | 28.7% | 44.8% |
| Mean | 86.6% | 83.0% |
| Median | 85.4% | 83.5% |
| Interquartile 25% (IQ1) | 83.5% | 81.4% |
| Interquartile 75% (IQ3) | 88.9% | 86.6% |
| Interquartile Range (IQR) | 5.4% | 5.3% |
| Standard Deviation (Sample) | 6.5% | 7.9% |
| Standard Deviation (Population) | 6.5% | 7.8% |
Similar Demographics by In Labor Force | Age 25-29
Demographics Similar to Immigrants from Peru by In Labor Force | Age 25-29
In terms of in labor force | age 25-29, the demographic groups most similar to Immigrants from Peru are Canadian (84.7%, a difference of 0.0%), Immigrants from Colombia (84.7%, a difference of 0.0%), British (84.7%, a difference of 0.010%), Immigrants from Ghana (84.7%, a difference of 0.010%), and Immigrants from Western Africa (84.7%, a difference of 0.010%).
| Demographics | Rating | Rank | In Labor Force | Age 25-29 |
| Immigrants | Taiwan | 62.2 /100 | #153 | Good 84.7% |
| Immigrants | Sri Lanka | 61.7 /100 | #154 | Good 84.7% |
| Indians (Asian) | 61.6 /100 | #155 | Good 84.7% |
| French | 61.0 /100 | #156 | Good 84.7% |
| British | 60.4 /100 | #157 | Good 84.7% |
| Immigrants | Ghana | 60.2 /100 | #158 | Good 84.7% |
| Immigrants | Western Africa | 60.1 /100 | #159 | Good 84.7% |
| Immigrants | Peru | 58.6 /100 | #160 | Average 84.7% |
| Canadians | 58.5 /100 | #161 | Average 84.7% |
| Immigrants | Colombia | 58.3 /100 | #162 | Average 84.7% |
| Argentineans | 57.9 /100 | #163 | Average 84.7% |
| Ghanaians | 57.6 /100 | #164 | Average 84.7% |
| Immigrants | Burma/Myanmar | 57.4 /100 | #165 | Average 84.7% |
| Immigrants | Spain | 56.9 /100 | #166 | Average 84.7% |
| Indonesians | 56.5 /100 | #167 | Average 84.7% |
Demographics Similar to Immigrants from Guatemala by In Labor Force | Age 25-29
In terms of in labor force | age 25-29, the demographic groups most similar to Immigrants from Guatemala are Spanish (83.6%, a difference of 0.010%), Immigrants from Bahamas (83.6%, a difference of 0.020%), Pennsylvania German (83.6%, a difference of 0.020%), Delaware (83.7%, a difference of 0.040%), and Immigrants from Haiti (83.7%, a difference of 0.050%).
| Demographics | Rating | Rank | In Labor Force | Age 25-29 |
| Bahamians | 0.2 /100 | #251 | Tragic 83.7% |
| Guatemalans | 0.2 /100 | #252 | Tragic 83.7% |
| Immigrants | Trinidad and Tobago | 0.2 /100 | #253 | Tragic 83.7% |
| Spaniards | 0.2 /100 | #254 | Tragic 83.7% |
| Haitians | 0.2 /100 | #255 | Tragic 83.7% |
| Immigrants | Haiti | 0.2 /100 | #256 | Tragic 83.7% |
| Delaware | 0.2 /100 | #257 | Tragic 83.7% |
| Immigrants | Guatemala | 0.1 /100 | #258 | Tragic 83.6% |
| Spanish | 0.1 /100 | #259 | Tragic 83.6% |
| Immigrants | Bahamas | 0.1 /100 | #260 | Tragic 83.6% |
| Pennsylvania Germans | 0.1 /100 | #261 | Tragic 83.6% |
| Immigrants | Fiji | 0.1 /100 | #262 | Tragic 83.6% |
| West Indians | 0.1 /100 | #263 | Tragic 83.5% |
| Puget Sound Salish | 0.1 /100 | #264 | Tragic 83.5% |
| Cubans | 0.1 /100 | #265 | Tragic 83.5% |